
Is a topic really rising? Explore research trends with JWST and ALMA
A topic keeps appearing in your reading: is it an impression, a one-week spike or sustained growth? SummarizePaper’s Rising topics tool helps explore that question through the words used in new papers’ titles and abstracts.
We will follow millimeter in astrophysics, compare its history with JWST and ALMA, then open a paper and its figures. The goal is to choose a useful reading while understanding what the numbers establish.
1. Choose a field and note the submission week
Open Rising topics and select Astrophysics (astro-ph). The all-arXiv overview and a single term’s history are available for free. Premium adds field views, personalization, comparison of three terms and count exports.
Counting the previous Monday-to-Sunday submission week starts on Tuesday at 06:00 UTC — 07:00 in Paris in winter, 08:00 in summer. This follows the normal Monday evening arXiv announcement in US Eastern time, which includes the last weekend submissions. Counts use first versions rather than updates. Moderation-delayed announcements may still be missing from the first count; results appear as each field is processed.
The 19–25 October 2026 submission week therefore becomes eligible on Tuesday 27 October at 06:00 UTC, without waiting until Saturday 31 October.
The guide’s screenshots were taken on 28 October before this scheduling change and deliberately retain the 12–18 October 2026 archive. To reproduce their values, open that archived week. It is not the expected current week: keep the scope and date with any interpretation.
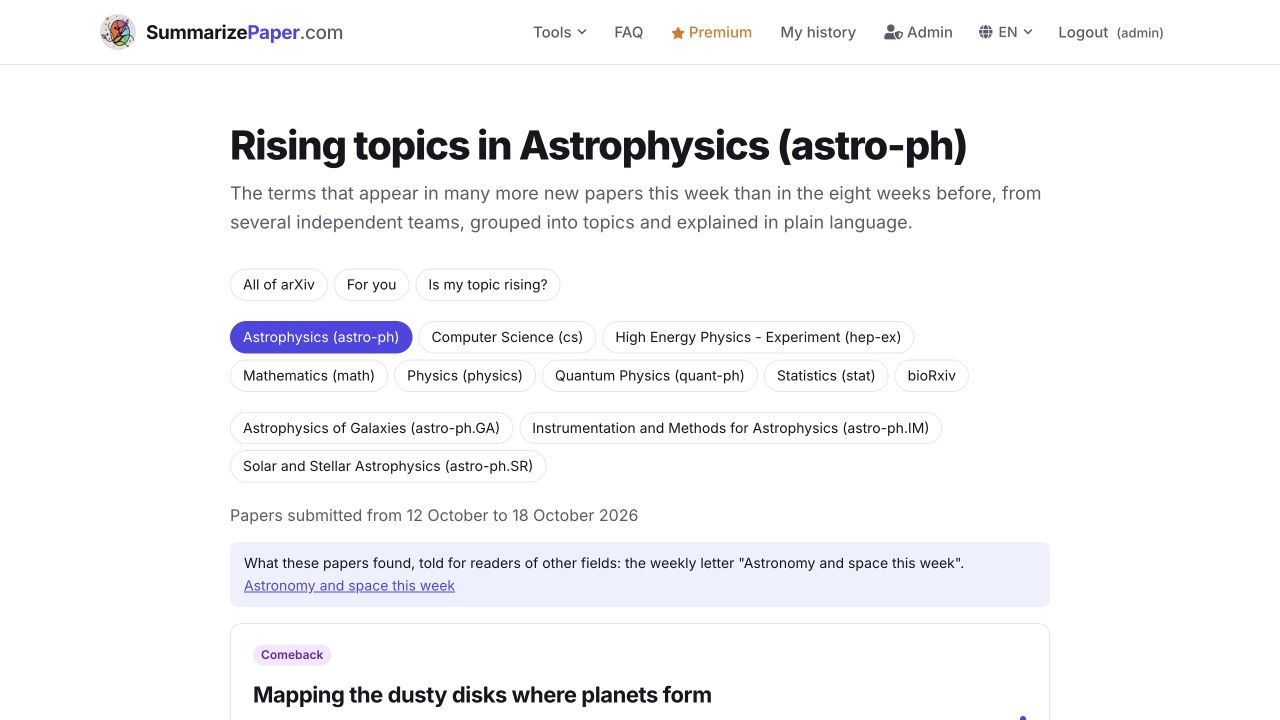
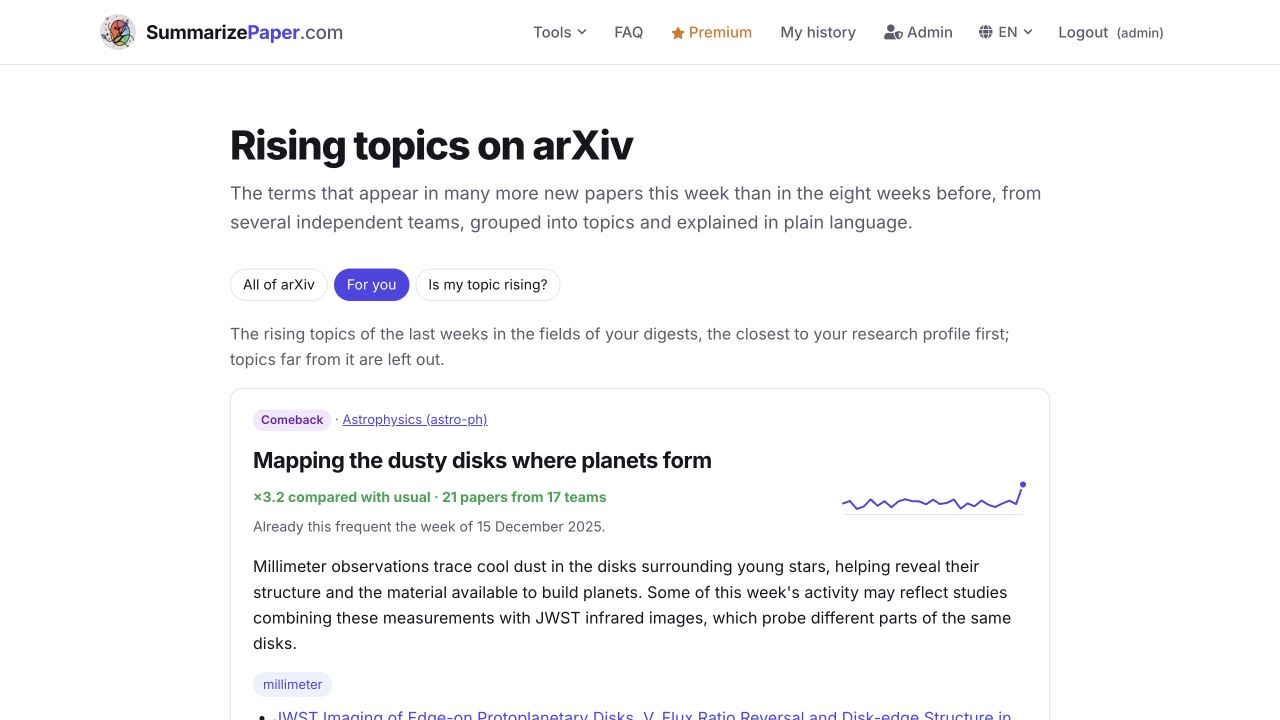
2. Read a card: ×3.2, 21 papers, 17 teams
Mapping the dusty disks where planets form displays ×3.2 compared with usual, with 21 papers from 17 teams. The term behind it is millimeter.
The multiplier describes the share of new papers using the term, compared with the previous eight weeks. It is neither a citation multiplier nor a quality score. The Comeback label notes that the term was already this frequent in the week of 15 December 2025.
Weekly detection requires, among other criteria, at least a doubling in share and several independent teams according to the tool’s author grouping. An AI then groups terms and writes an explanation; counts trigger the signal. The explanation suggests possible causes to investigate in the papers.
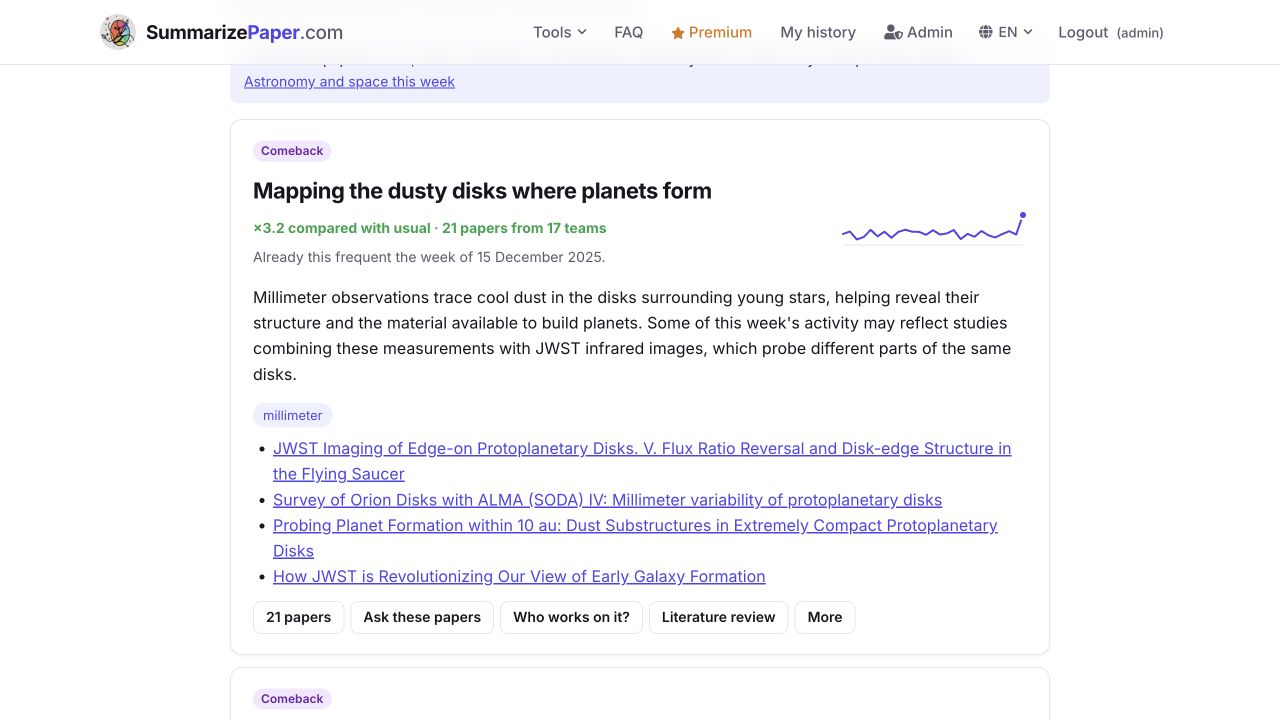
3. Check whether the spike lasts
Click millimeter or its small curve. The history keeps the Astrophysics scope. Its verdict says “millimeter is not clearly rising”: its share is 133.5 per 10,000 papers over the latest 13 weeks, against 124.2 over the previous 13 weeks.
That verdict and ×3.2 answer different questions: one compares two 13-week periods; the other compares one week with the previous eight. A recent spike can coexist with little clear change across three months.
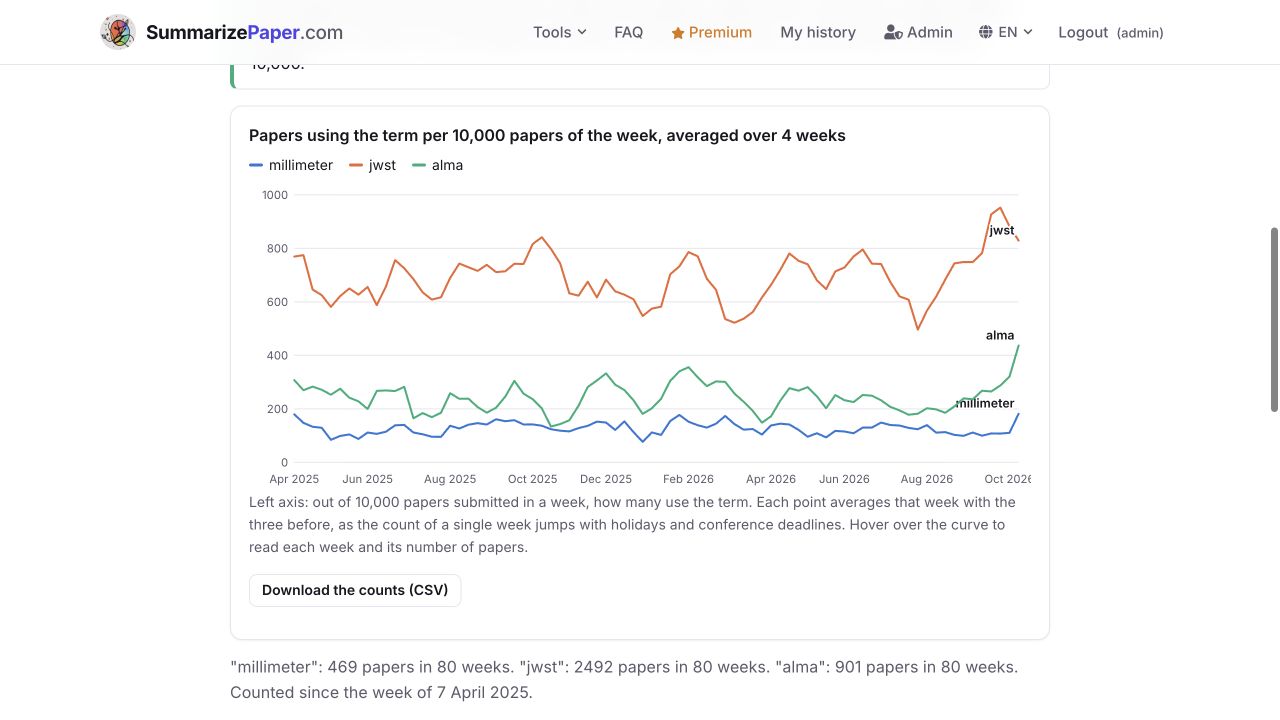
The large chart shows the weekly share averaged over four weeks. Its final point differs from the latest week’s raw value: smoothing reduces jumps associated with holidays or deadlines.
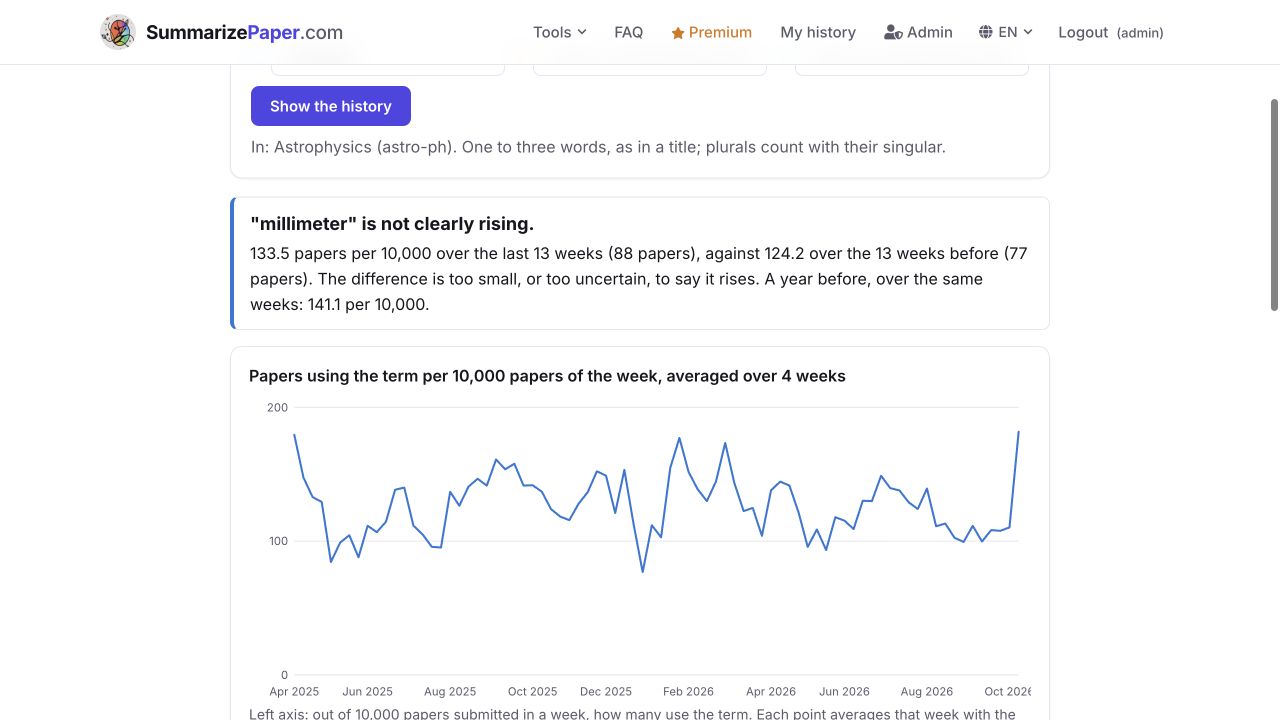
4. Compare three terms within the same scope
Enter JWST and ALMA in the additional fields and select Show the history. Keep the field inherited from the card. Terms are matched against title and abstract vocabulary, generally in English: one to three words, with plurals counted alongside singulars. Acronyms are accepted.
millimeter, JWST and ALMA are related, but they name different things: a wavelength range and two facilities. The comparison helps distinguish their trajectories; it does not measure their relative scientific performance.
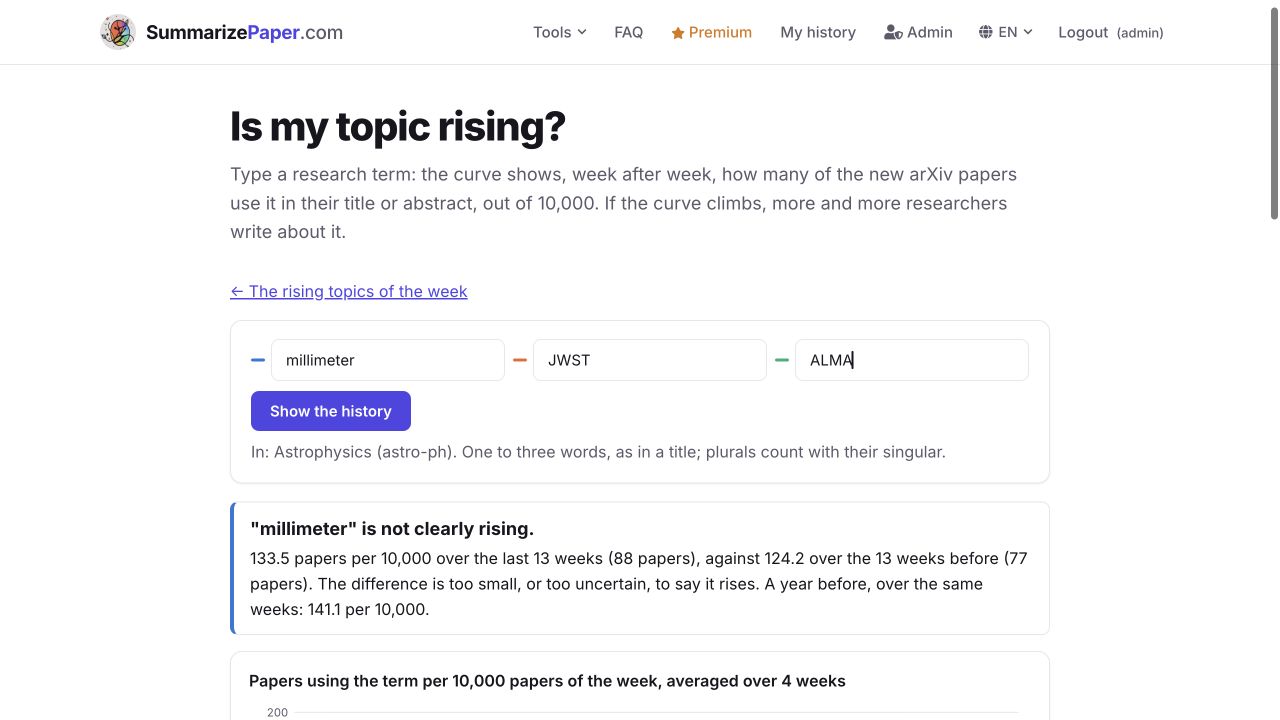
This consultation gives the following results:
| Term | Share over the latest 13 weeks | Share over the previous 13 weeks | Displayed verdict |
|---|---|---|---|
| millimeter | 133.5 / 10,000 | 124.2 / 10,000 | Not clearly rising |
| JWST | 752.5 / 10,000 | 697.0 / 10,000 | Not clearly rising |
| ALMA | 298.9 / 10,000 | 227.5 / 10,000 | Rising, ×1.3 |
A larger count alone does not establish a rise: the size and uncertainty of the difference matter. Papers may use several terms, so adding the columns does not give the number of distinct publications.
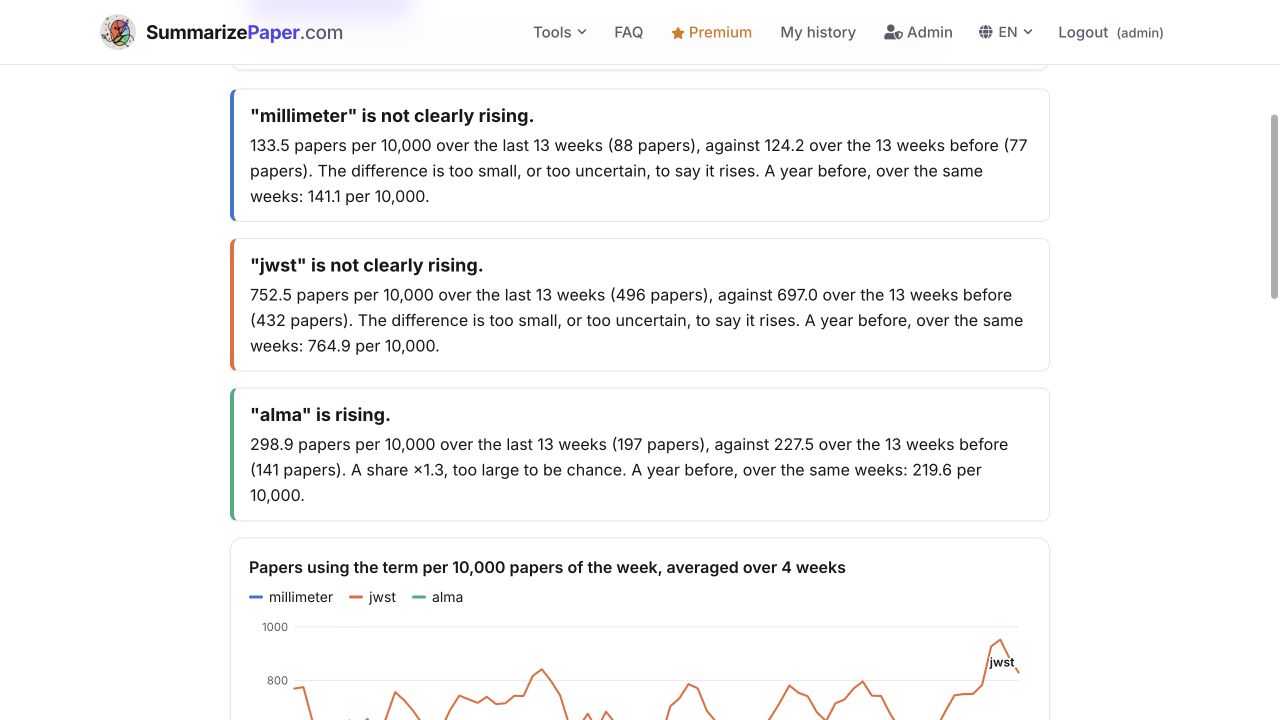
Read the curves together. JWST is higher, but the useful comparison is how the curves move. Broad, common or ambiguous terms have an advantage in height. Hover over the chart to inspect a week and its paper count.
The curve measures vocabulary use within this corpus. It does not demonstrate a discovery, measure citations or cover all scientific literature outside arXiv.
5. Inspect the numbers and export them
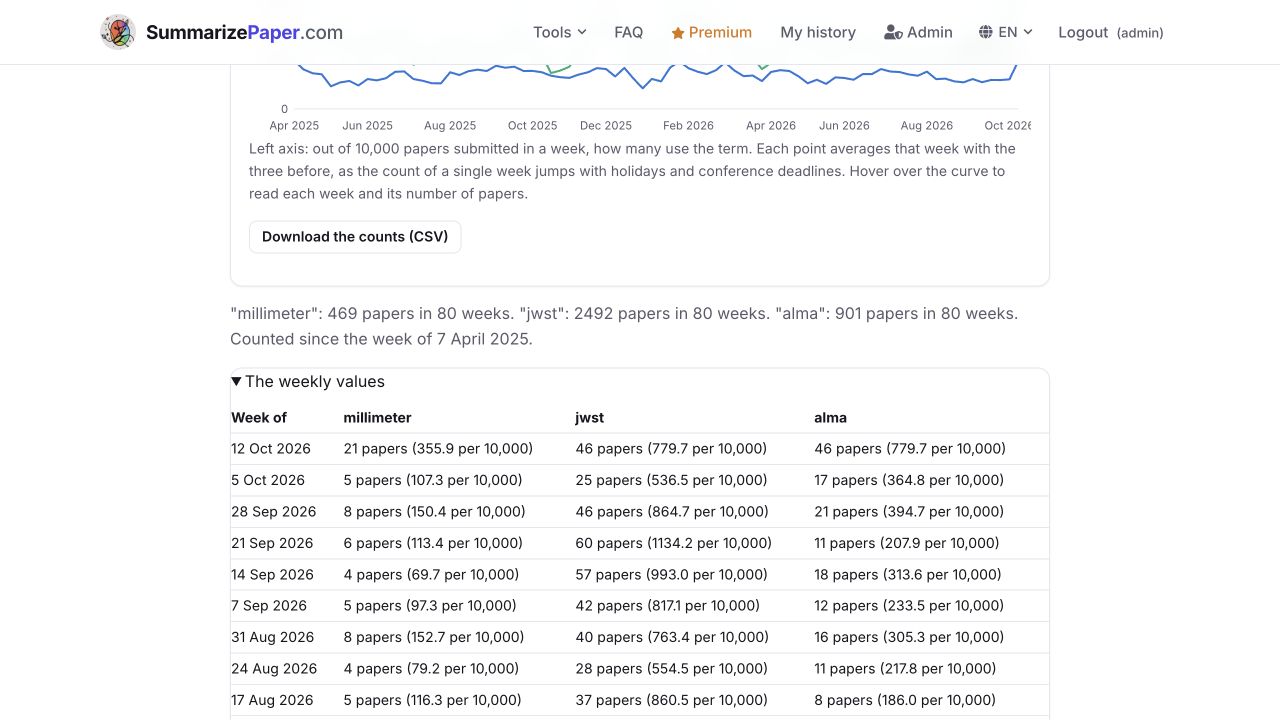
Expand The weekly values. In the week of 12 October 2026, millimeter appears in 21 papers, or 355.9 per 10,000. This raw weekly value differs from the chart’s smoothed point.
Download the counts (CSV) preserves the weeks, total papers in the scope, and each term’s counts and shares. Keep the field and access date with your export.
A week in which only one paper uses a term counts as zero in this history. A zero therefore does not establish a complete absence of publications.
6. Open the 21 papers and check the grouping
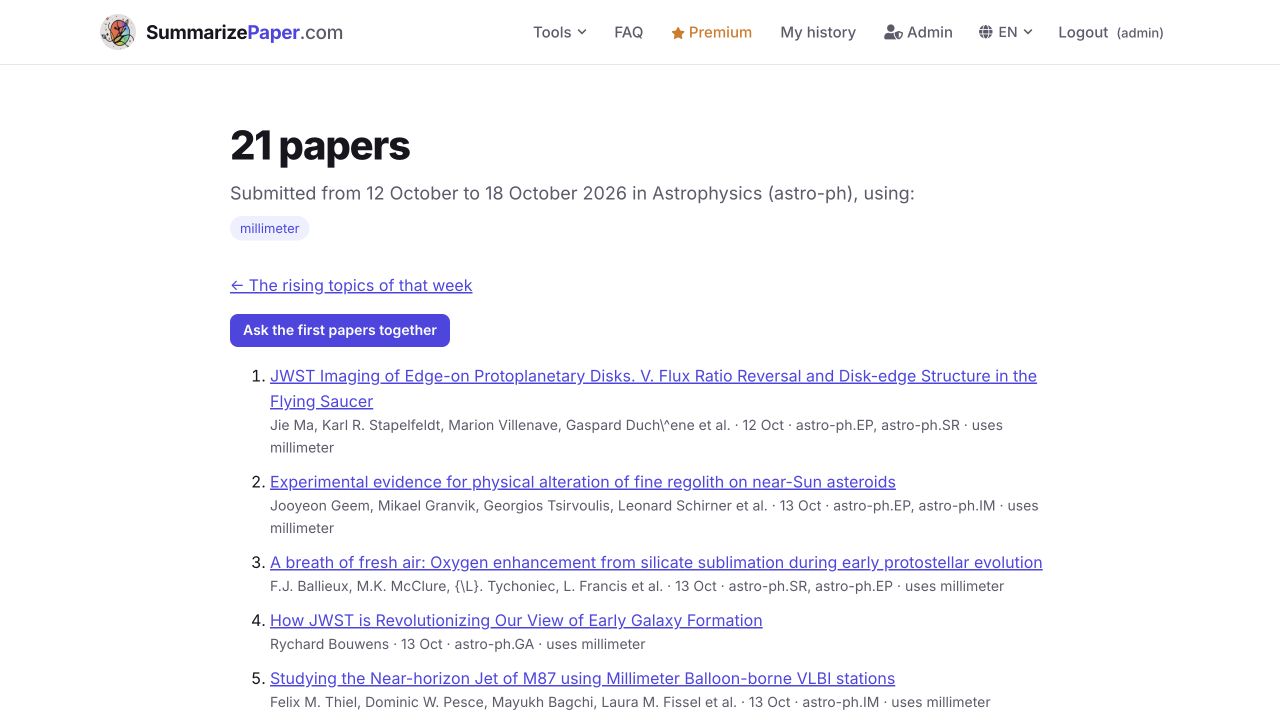
Return to the week’s card and open 21 papers. The list shows titles, authors, categories and matching terms. It includes planetary disks, but also early galaxies, the M87 jet and instrumentation.
That diversity explains why a card’s title does not describe every reference precisely. millimeter links papers through vocabulary; reading establishes the specific scientific question.
Ask these papers, on the card, prepares its examples in the chat. The complete list also offers to ask its first papers together. Check the loaded titles before comparing: opening the chat does not establish that every source has available full text.
7. Read a full-text example: the Flying Saucer
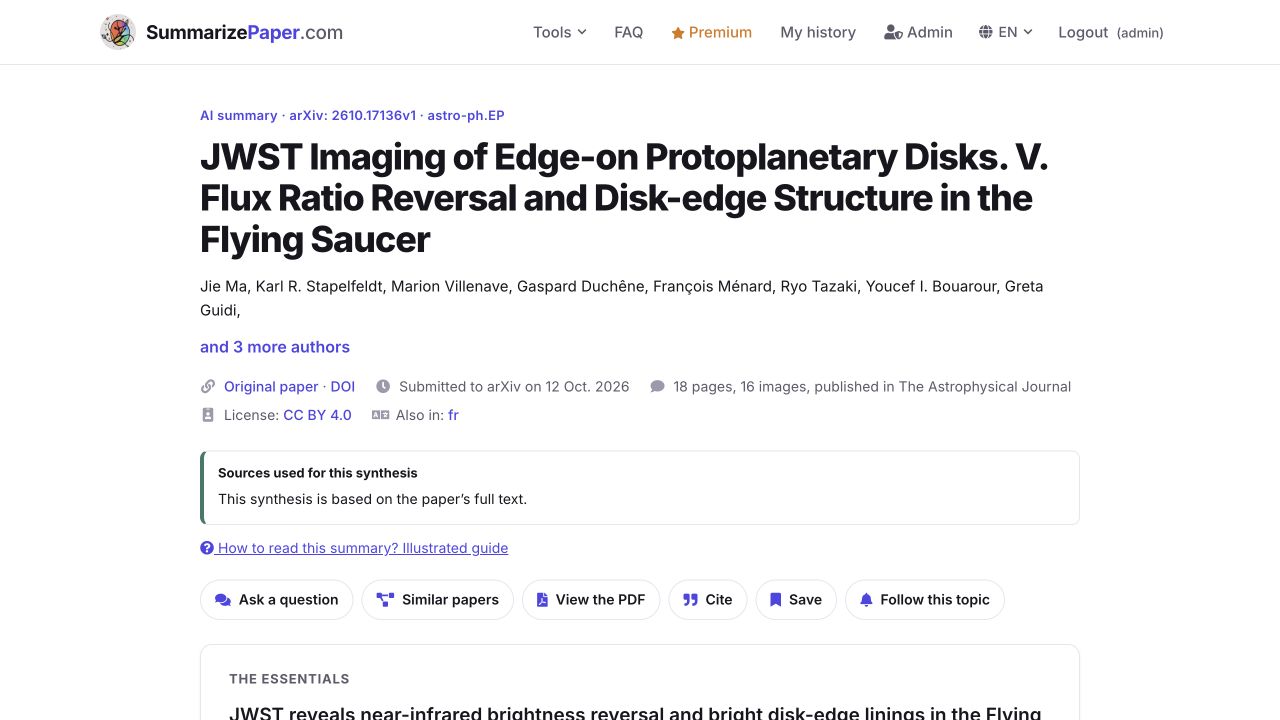
Choose JWST Imaging of Edge-on Protoplanetary Disks. V. Flux Ratio Reversal and Disk-edge Structure in the Flying Saucer and open its reading page.
The header shows CC BY 4.0 and This synthesis is based on the paper’s full text. Its arXiv submission is dated 12 October 2026; the page also notes publication in The Astrophysical Journal. The trend uses the submission week, independently of the journal publication timeline.
The study combines JWST and Hubble images with ALMA data. Read its findings and limitations: the authors investigate the brightness of the two nebulae of an edge-on disk. Their geometric model illustrates a possible explanation rather than a unique solution. Check the source on arXiv.
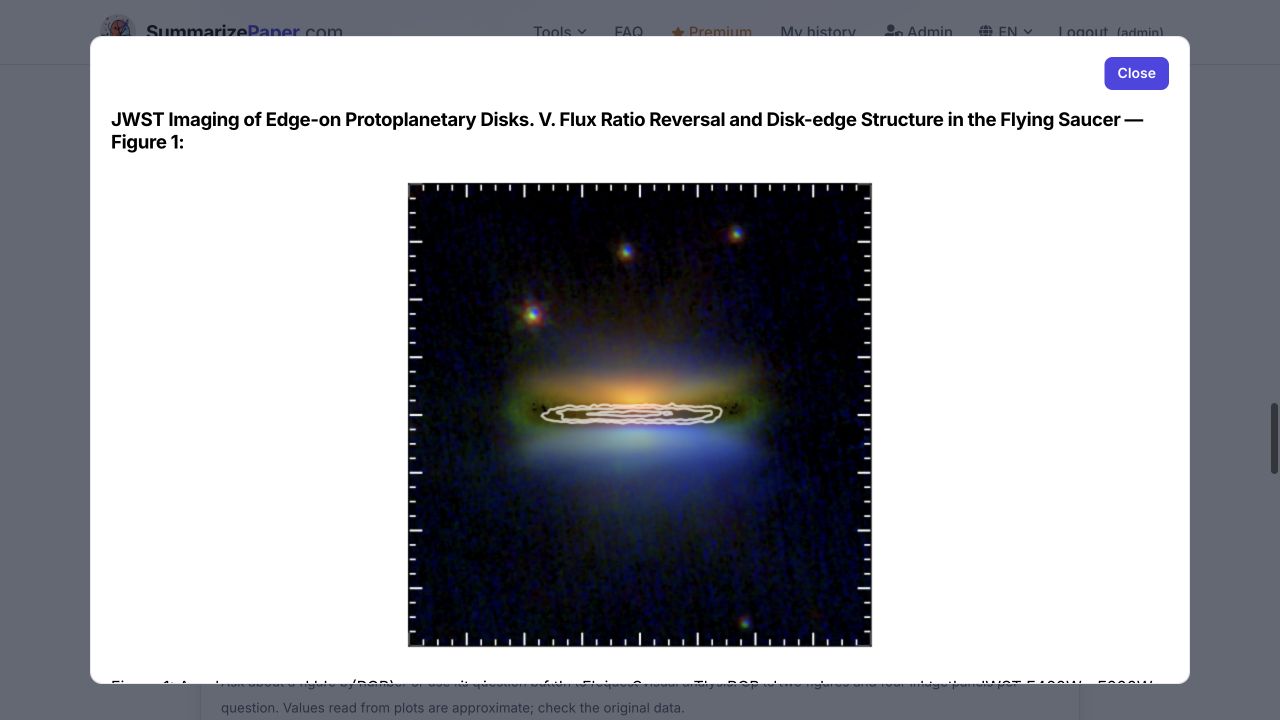
In Figures and plots, this version’s gallery contains 17 figures, including an appendix figure. Enlarge Figure 1: the color composite comes from JWST, while the white contours trace ALMA millimeter continuum. This provides a direct visual connection between the terms we compared.
Colors represent filters and image processing. The contours are not a count of planets; they help compare observed structures.
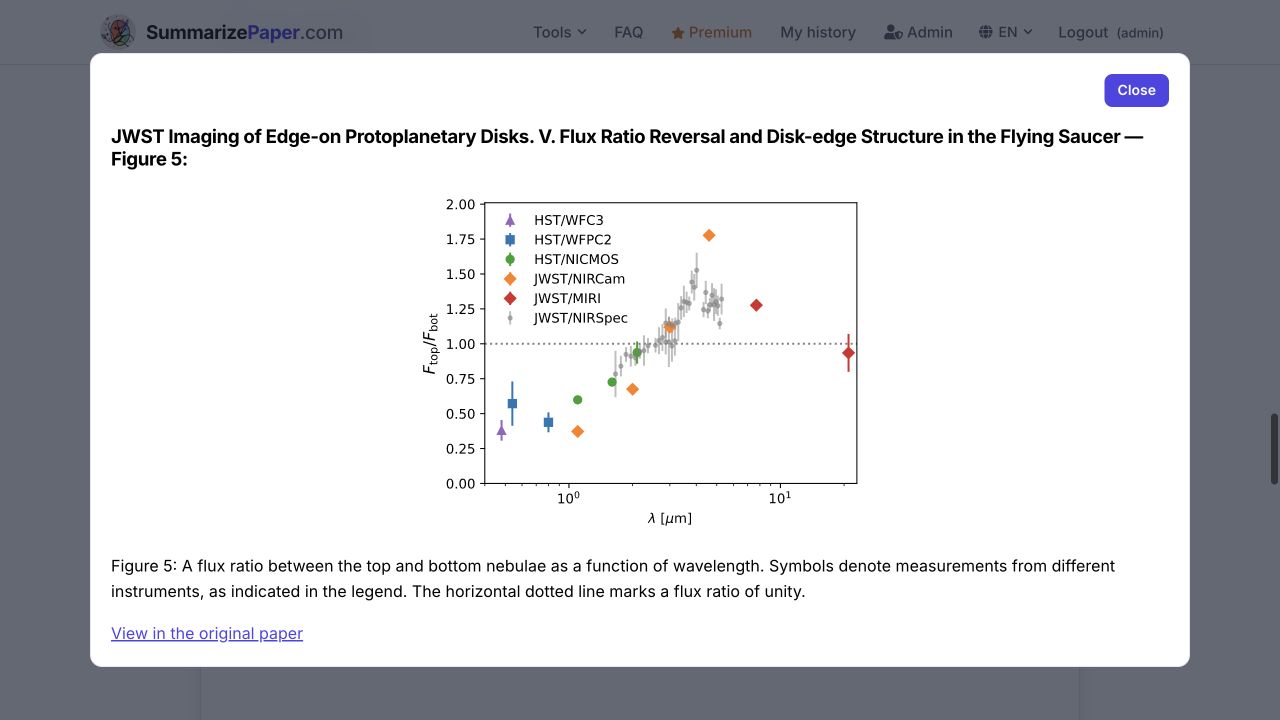
Next open Figure 5. It plots the upper-to-lower nebula flux ratio against wavelength. The horizontal line at 1 marks equal brightness; crossing it makes the reversal visible.
A useful reading question is: “Which measurements establish the flux-ratio reversal, and which limitations prevent a unique geometric interpretation?” The plot shows measurements; the explanation involving a misaligned inner disk also relies on modeling. Check instruments, epochs and uncertainties in the original figure.
8. Save a reading and organize follow-up
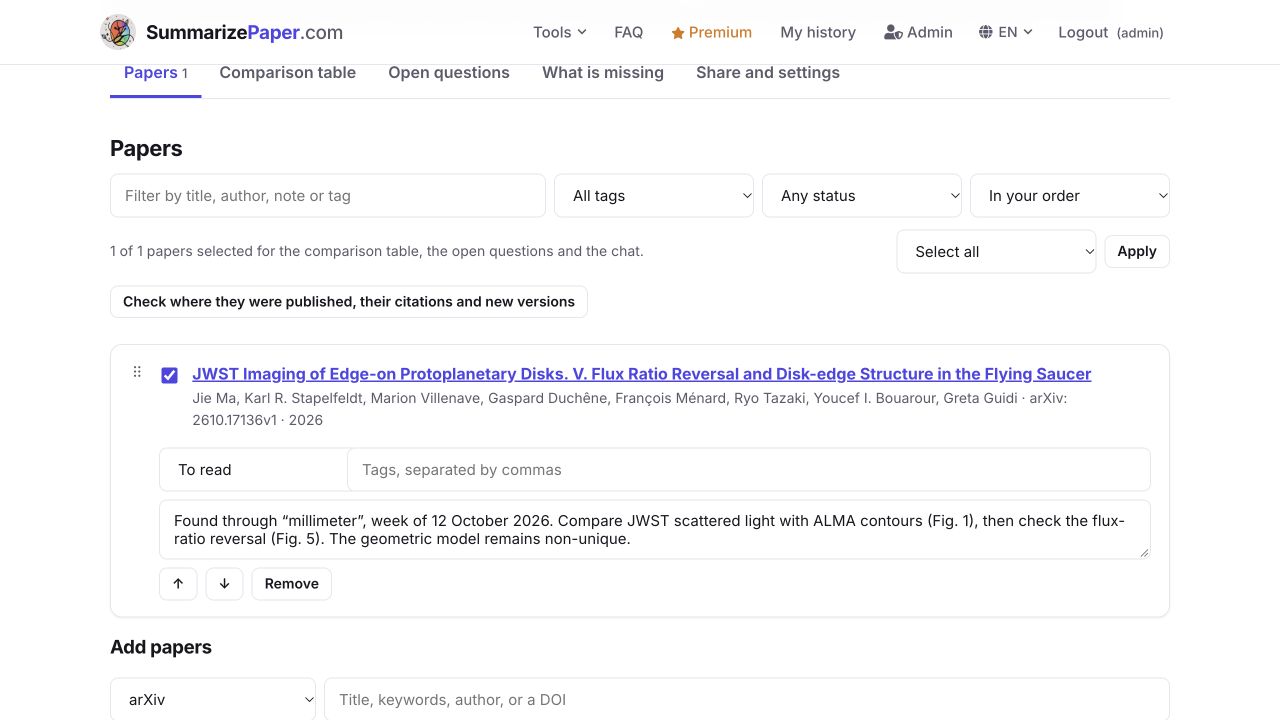
In the paper tools, choose a new collection, name it and add the paper. In To read — JWST and ALMA in disks, we saved the To read status and a note linking the 12 October signal to Figures 1 and 5 and the model’s non-uniqueness.
The note preserves why you selected the paper. Add other publications and use the collection comparisons when useful. For narrower monitoring, build a focused scientific query rather than automatically following everything using millimeter.
9. Find the topics closest to your research
The Premium For you view gathers topics from your digest fields and ranks them against the research profile described there. In this example, dusty disks and the chemistry of young systems appear.
If the view is empty, check your digest categories and profile; there may also have been no recent signal close to your work. Weekly letters complement the counts with accounts of the findings. To identify authors behind a specific approach, continue with Who works on it?.
A useful path is notice the signal, put it in context, check the papers, then decide what to read or follow.
Discover a rise or check your own term
Explore rising research topics