
Who works on exomoons? From research approaches to papers worth reading
A researcher map becomes useful when it answers a concrete question: who develops a method that complements mine, and which paper should I read to understand it? This guide uses Who works on it?, a Premium tool in SummarizePaper, to explore exomoons: satellites of planets around other stars.
We will compare interferometric astrometry with transits, transit timing variations (TTVs) and transit duration variations (TDVs). The workflow goes from creating a map to checking the publications behind a name and saving a reading collection. These English screenshots follow a completed search from 28 October 2026.
1. Create a map around a specific question
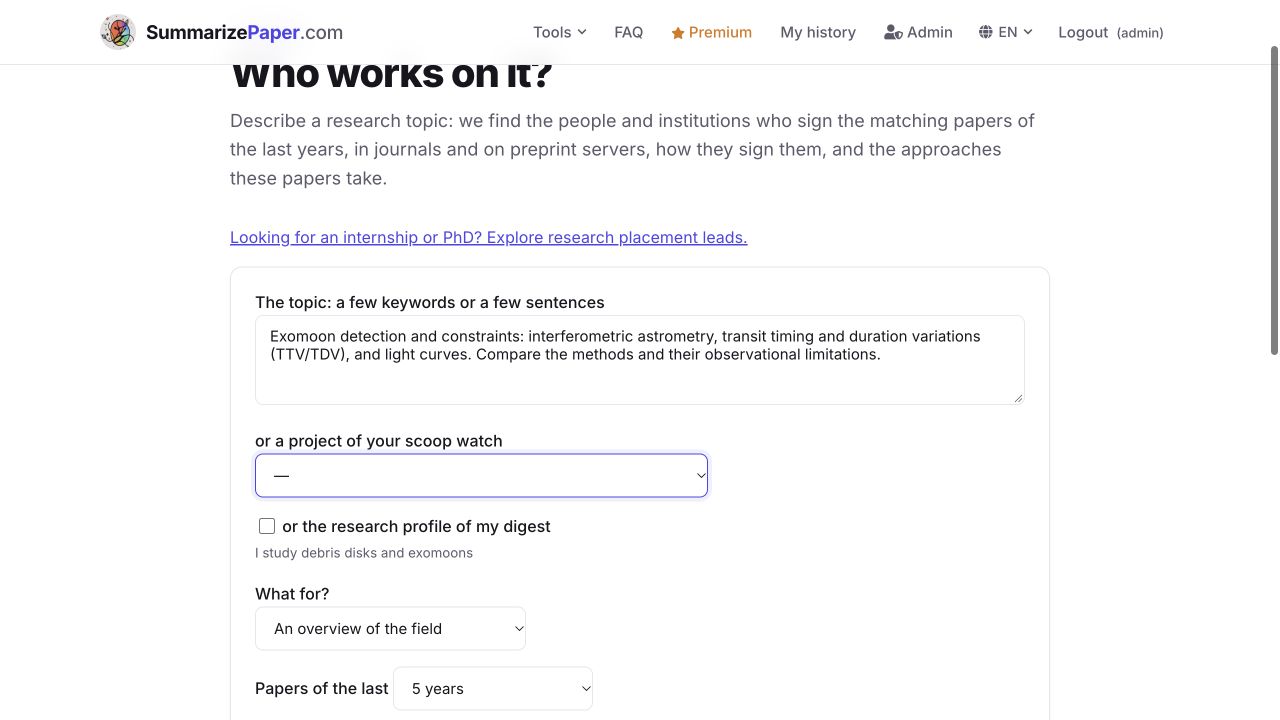
Open Who works on it? and enter a topic. For this example, use:
Exomoon detection and constraints: interferometric astrometry, transit timing and duration variations (TTV/TDV), and light curves. Compare the methods and their observational limitations.
Choose An overview of the field and a five-year window. The topic combines an object, several methods and a comparison question. “Exoplanets” alone would produce a much broader landscape.
An ORCID is optional. It helps identify your publications and scientific connections. Overview mode flags these people. Collaborator and competing-team modes exclude your recent coauthors; referee mode also applies institutional exclusions. Check actual relationships before contacting someone or suggesting a referee.
2. Read the coverage before comparing names
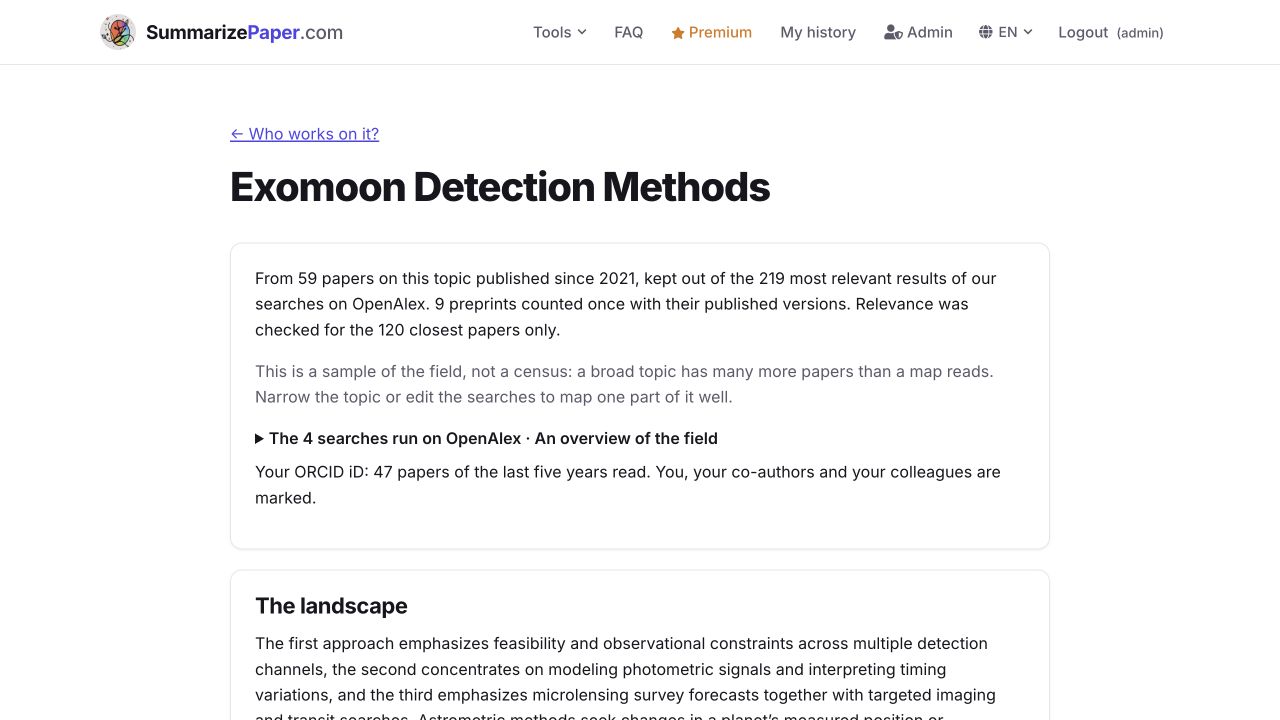
The English map retains 59 papers from 219 results, published since 2021. It displays 30 people, 15 institutions and three approaches. Nine preprints are counted once with their published versions; relevance was checked only for the closest 120 papers.
These counts describe a dated sample. They measure neither the entire field nor researcher quality. The independent French search in this guide retained 72 papers and five approaches: changing the wording can change retrieval and grouping.
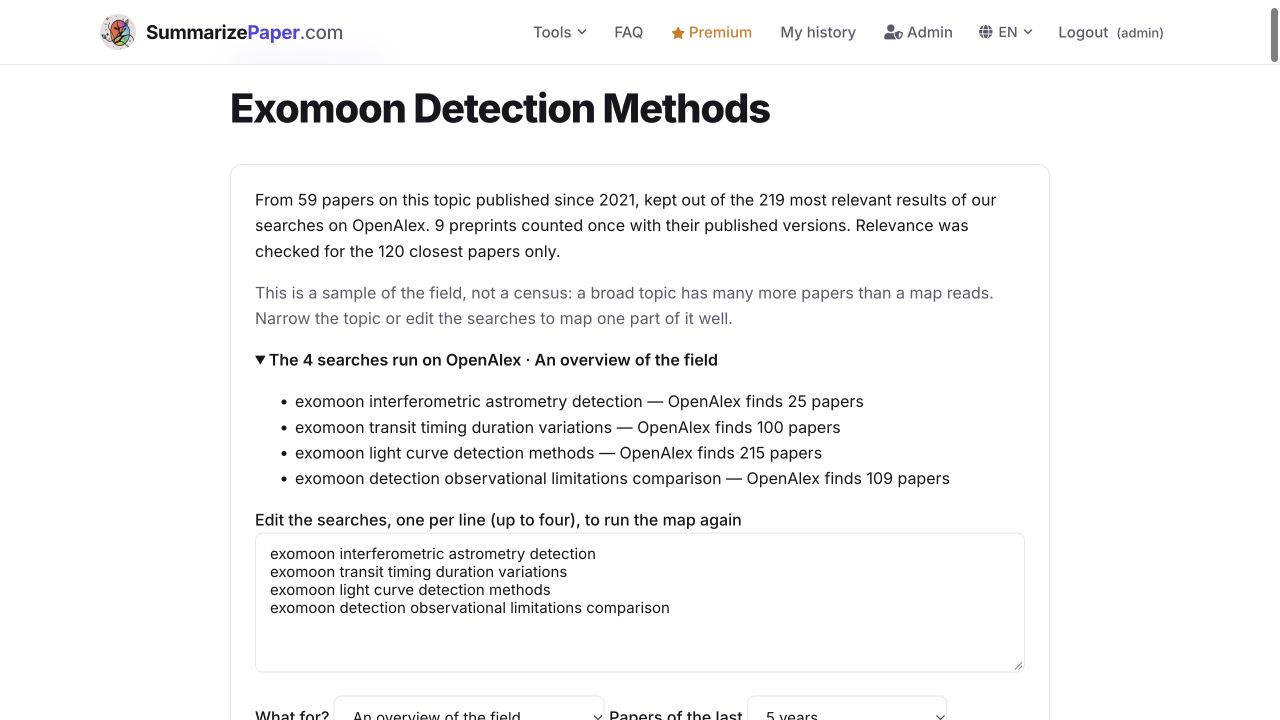
Expand The four searches run on OpenAlex. They include exomoon interferometric astrometry detection, exomoon transit timing duration variations and exomoon light curve detection methods.
The queries overlap, so adding their result counts does not give the number of independent studies. If an important method is missing, edit the searches, with one query per line, and rerun a more focused map. For instance, keep “interferometric astrometry” explicit when investigating that method rather than the whole detection landscape.
3. Compare approaches before people
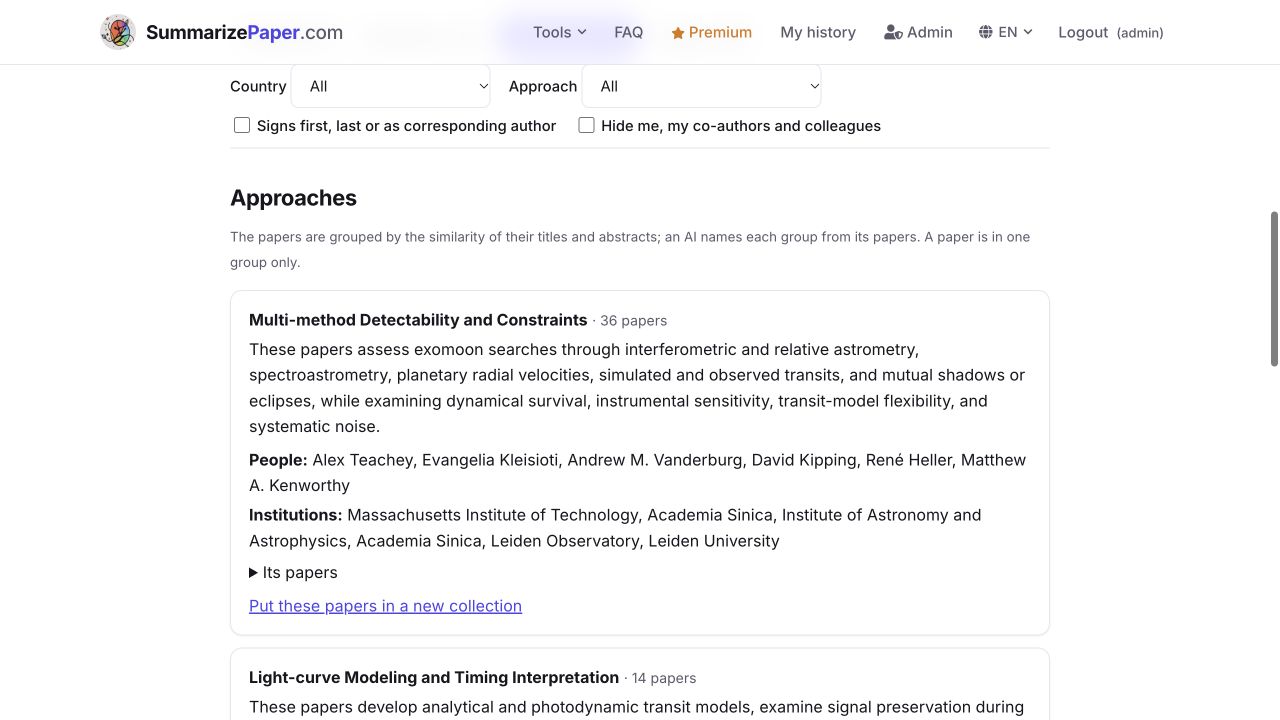
The Approaches tab groups papers with similar titles and abstracts; an AI labels each group. Each paper belongs to one group, even when it discusses several methods.
This map has three groups:
- Multi-method Detectability and Constraints: 36 papers;
- Light-curve Modeling and Timing Interpretation: 14;
- Microlensing Surveys and Targeted Searches: 9.
The first group helps explore observational limits, while the second focuses on interpreting transit signatures and timing. Expand Their papers to check the publications behind an approach. These are useful reading routes rather than a fixed taxonomy of exomoon science.
4. Narrow the list, then open the evidence
Return to People. Country, approach and authorship-role filters help narrow the displayed list. Selecting US and First, last or corresponding author leaves 9 of the 30 people in this English example.
The role filter reports bibliographic positions. It does not establish who led a project: authorship conventions vary across teams and fields.
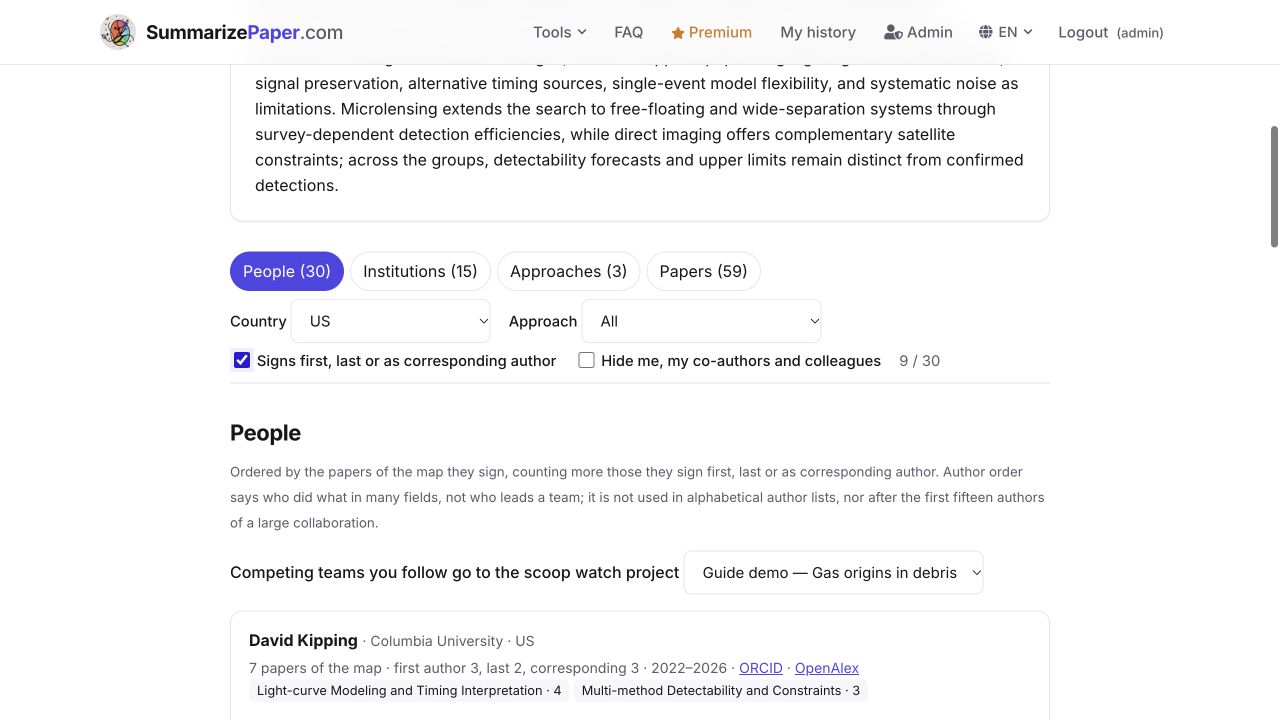
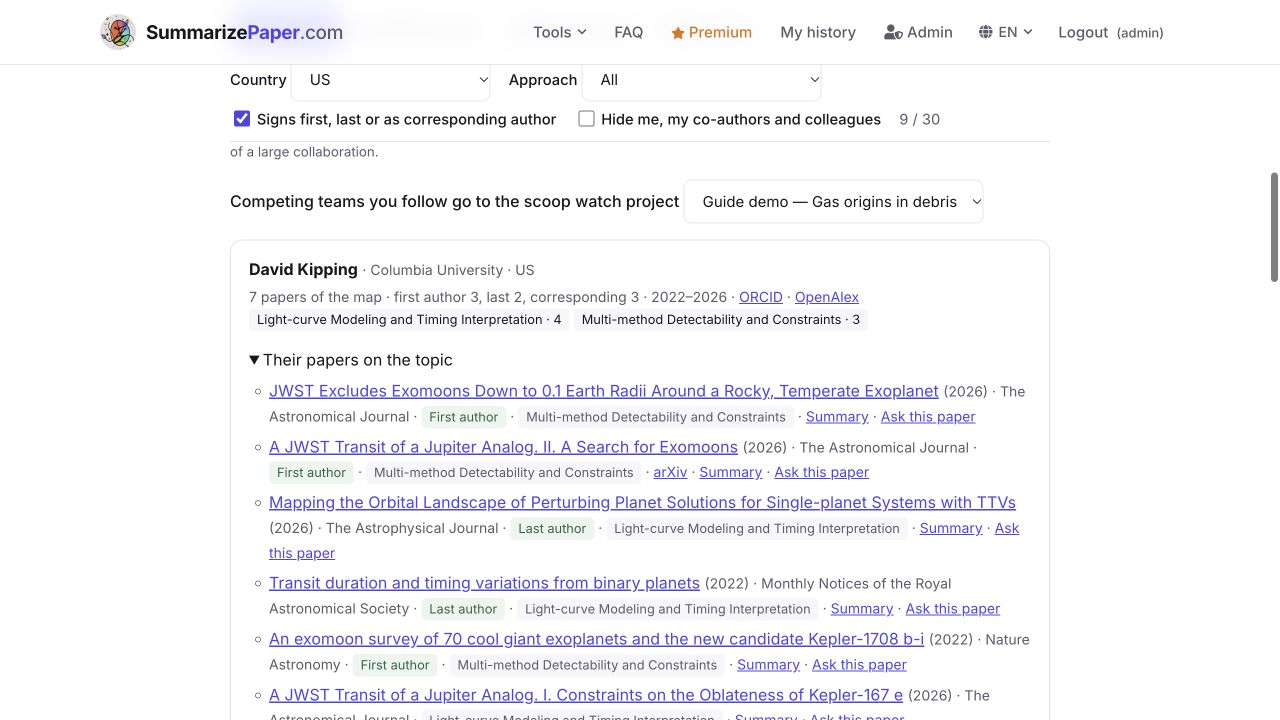
The David Kipping card lists Columbia University, an ORCID and seven papers in this sample. Expand Their papers to see the titles and publication years that explain the match, including the 2022 work on transit duration and timing variations from binary planets.
Choose a paper relevant to your question and inspect its method and limitations. The card’s count refers to this map, rather than the researcher’s complete publication record. It can differ from a separately generated map in another language.
5. Interpret institutions as affiliations
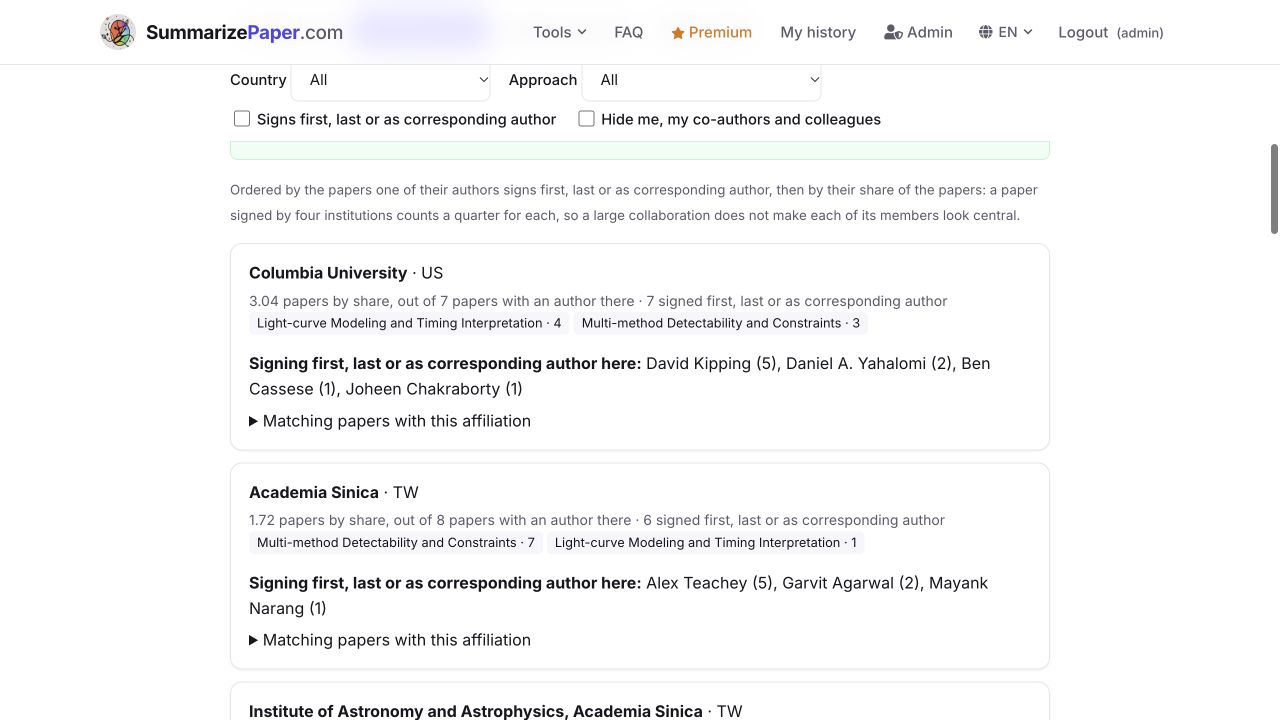
The Institutions tab shows where authors in the sample are affiliated. Contributions are fractional: an author with several affiliations does not count as a full contribution to each institution.
An institution may contain several laboratories or teams. Use the paper and an up-to-date professional page to identify the relevant group. The top institution is not automatically the best fit for your scientific question.
6. Follow a map entry into a full-text paper and its figures
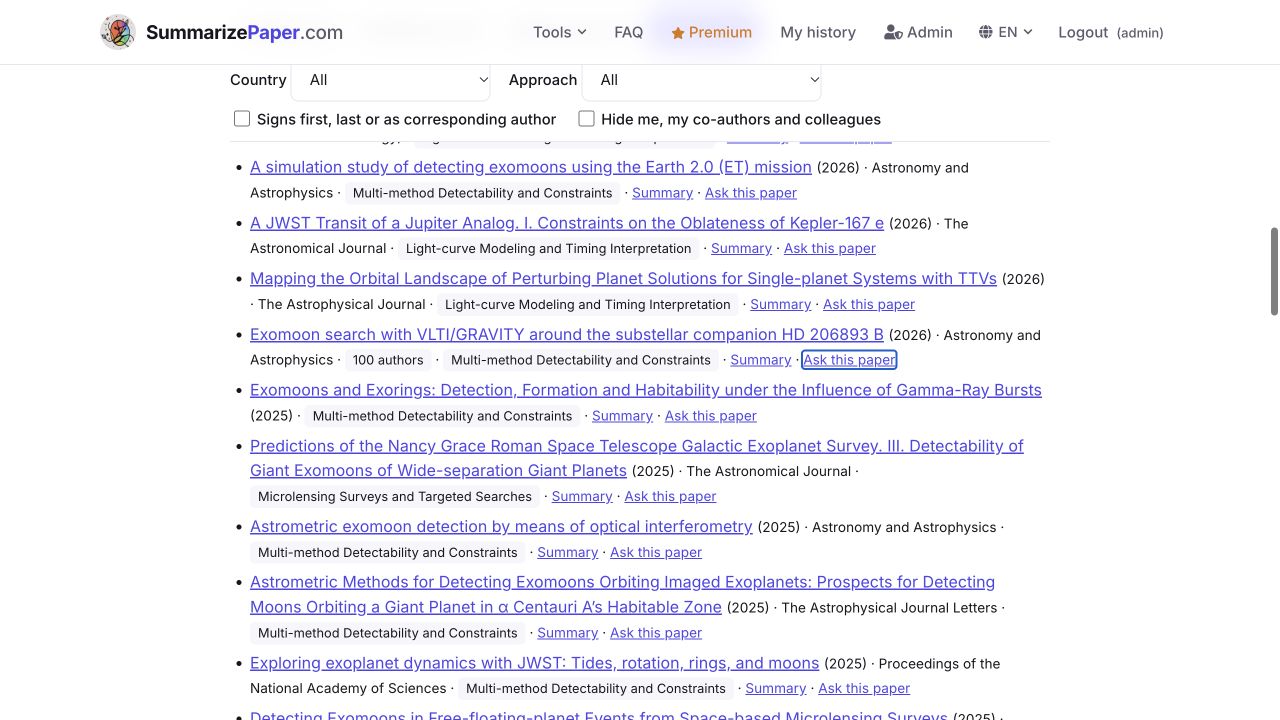
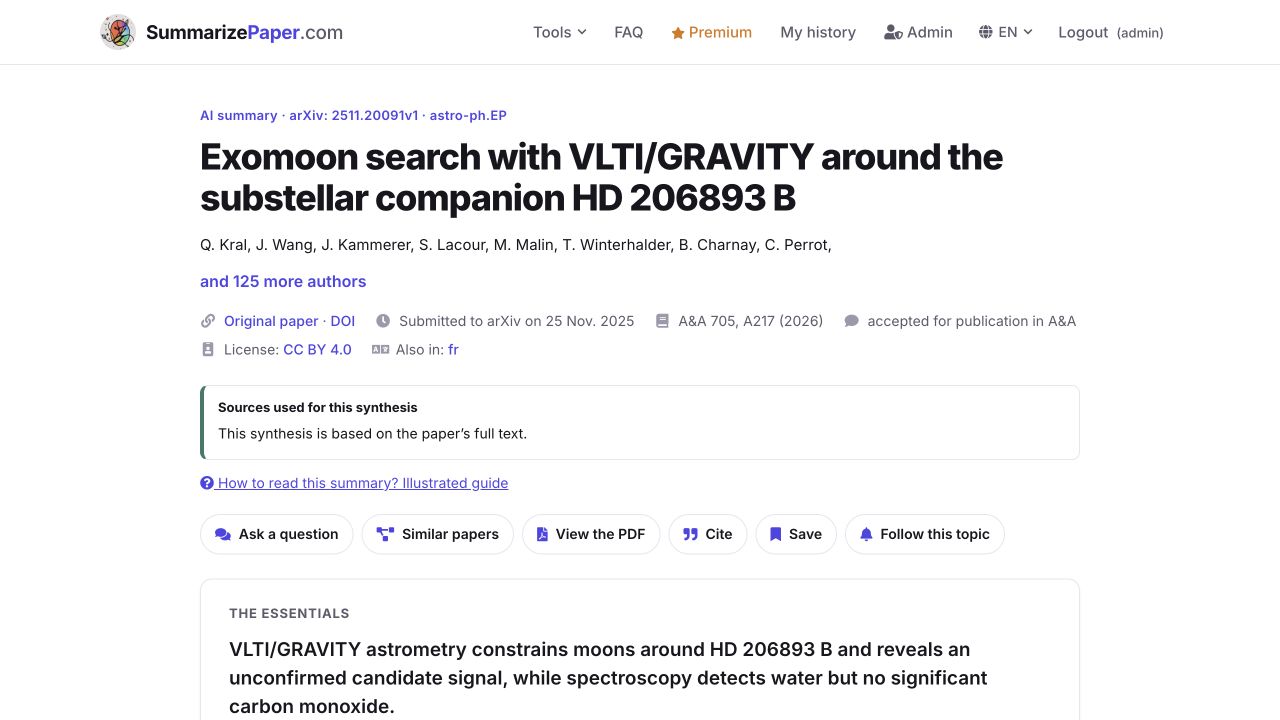
In Papers, find Exomoon search with VLTI/GRAVITY around the substellar companion HD 206893 B in the multi-method detectability group. It offers a concrete astrometric example to compare with transit-based methods.
Open its arXiv paper page in SummarizePaper. The header shows CC BY 4.0 and This synthesis is based on the paper’s full text. Its journal reference is A&A 705, A217 (2026); submission to arXiv on 25 November 2025 is a separate date. Use 2026 when citing the published work.
Read Method and Limitations: the authors search for a perturbation in HD 206893 B’s motion. The candidate signal remains unconfirmed, partly because systematic errors could produce similar residuals. Check the reference against the published journal article.
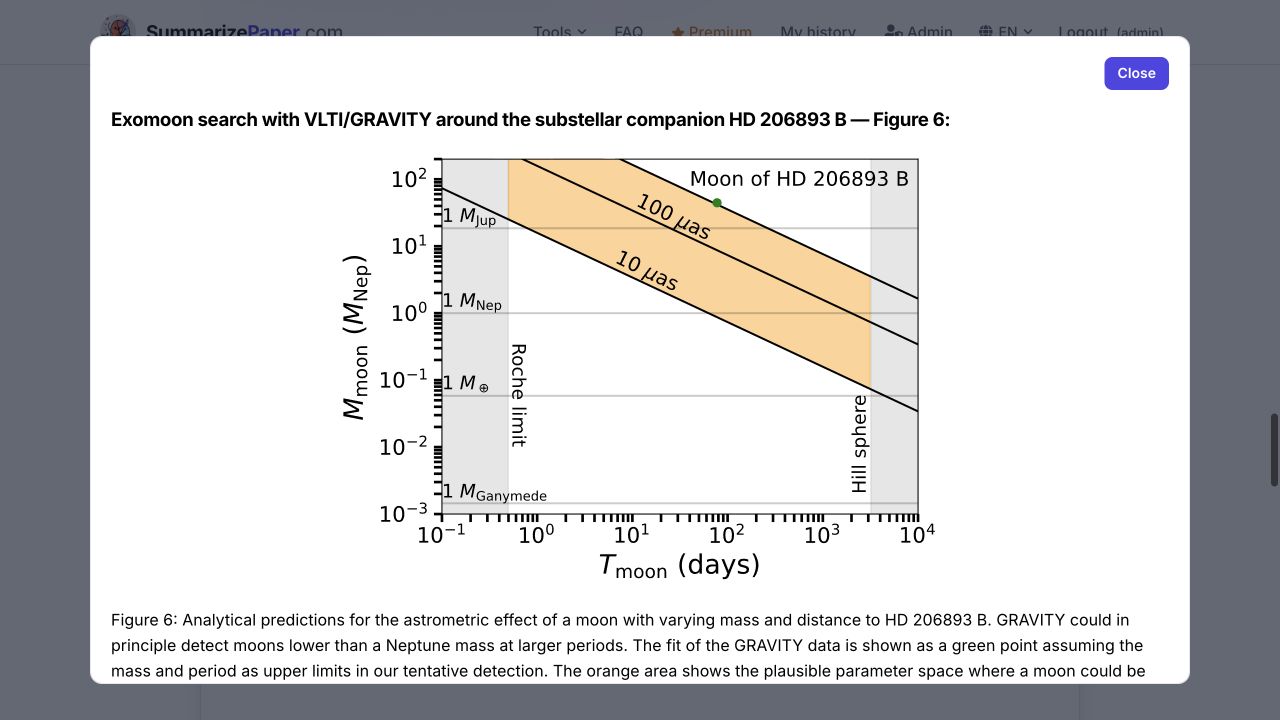
The Figures and plots gallery on this page contains 18 figures. Enlarge Figure 6 to compare moon mass and period with astrometric detectability. The curves and shaded regions depend on modeling assumptions; they do not constitute a confirmed detection.
A figure’s question button prepares a visual-analysis question. For example: “Which assumptions set the detectability limits in Figure 6, and why does the green point not establish a confirmed exomoon?” Check numerical values and the caption in the original source.
7. Turn an approach into a reading collection
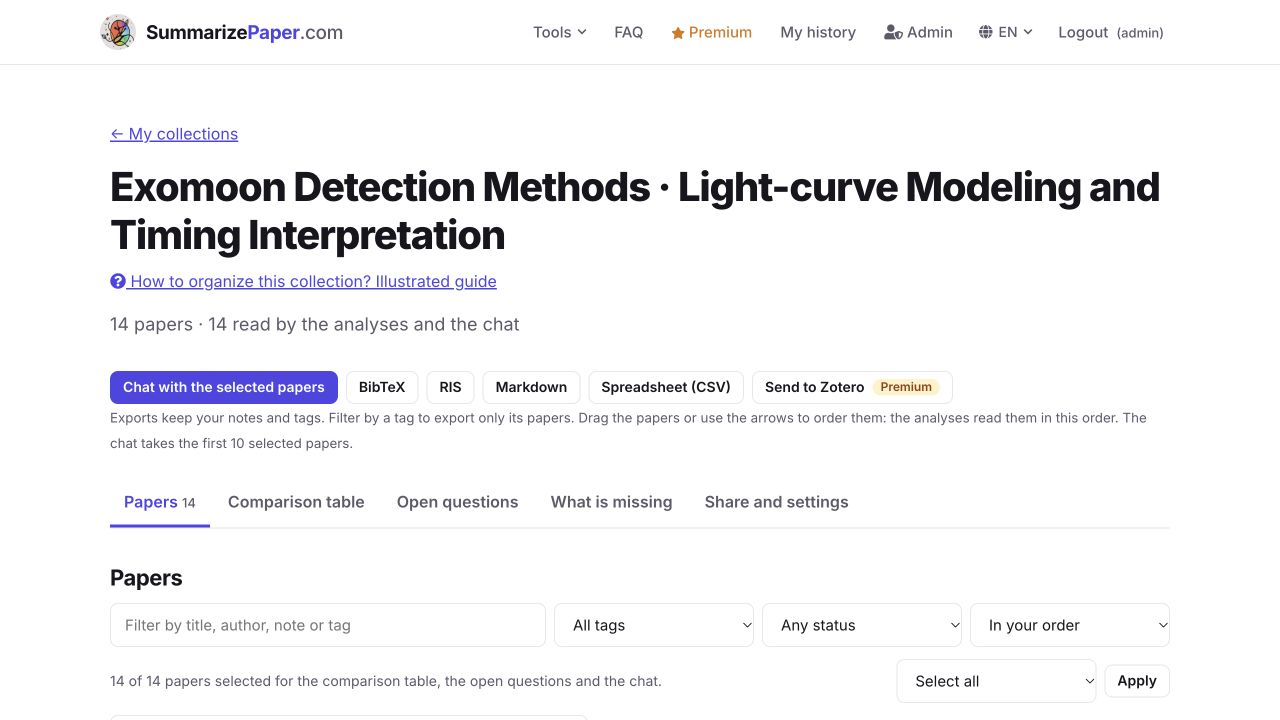
Return to Light-curve Modeling and Timing Interpretation and choose Put these papers in a new collection. The collection created here contains 14 entries, named after the map and approach.
You can add notes, set reading statuses and compare papers with the collection tools. A useful first note would ask: “Which signal could mimic an exomoon, and which test distinguishes the alternatives?”
Check titles and DOIs before counting independent studies. Although the search matches preprints to published versions, a preprint and journal paper can still appear separately in a collection. Fourteen entries do not guarantee fourteen independent studies.
8. Export or follow the map
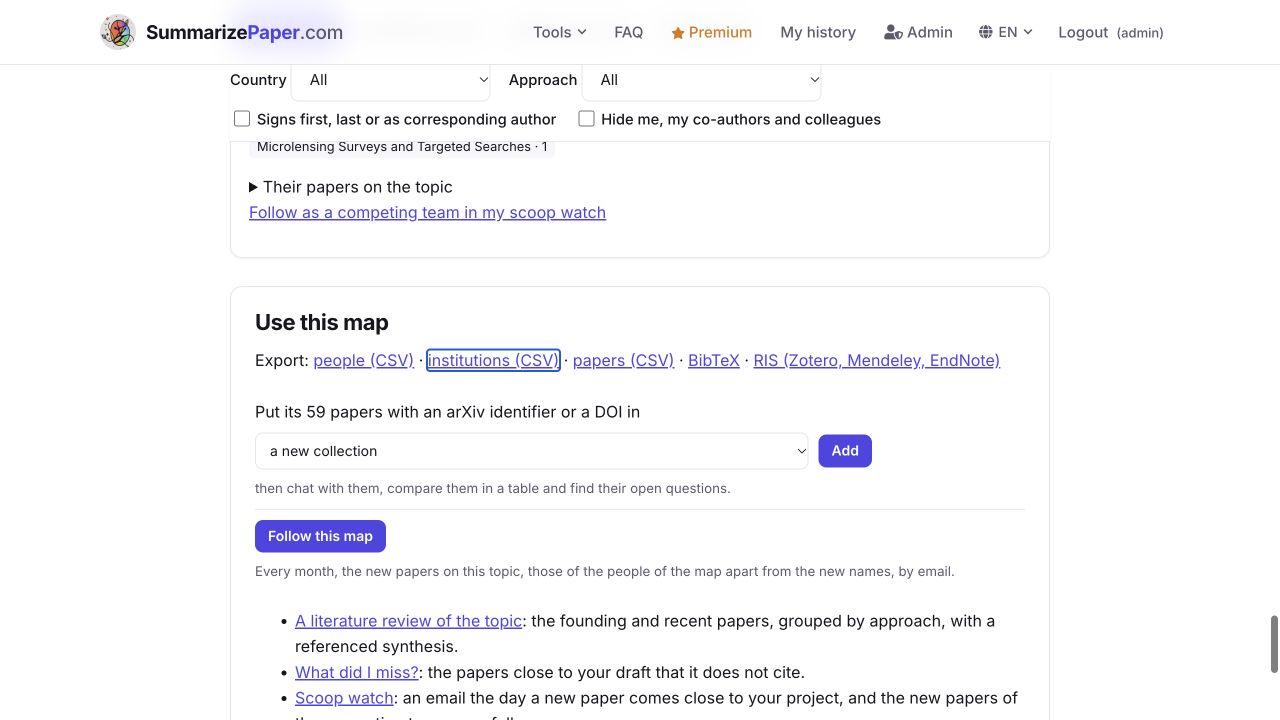
Under Use this map, separate CSV exports cover people, institutions and papers; BibTeX and RIS preserve references. They export the whole map: display filters do not restrict these downloads. To keep only one country, filter the CSV afterwards.
Follow this map offers a monthly update. To connect research monitoring to a project, select the correct project before following a competing team; the Scoop Watch guide explains that workflow.
You now have two practical outputs: researchers supported by relevant publications and a collection of methods to compare. For a search focused on supervision, continue with the research-placement contacts guide.
Map researchers working on your question · Premium
Create my research map