
Sagittarius A*: read the paper behind the image with Summaries
An orange ring around a dark center: the image of Sagittarius A* invites a closer look at how astronomers observe a black hole. The accompanying paper explains image reconstruction, comparisons with simulations and the remaining uncertainties. With Summaries, you can enter the study through its figures, read a synthesis, then return to the scientific passages supporting its findings.
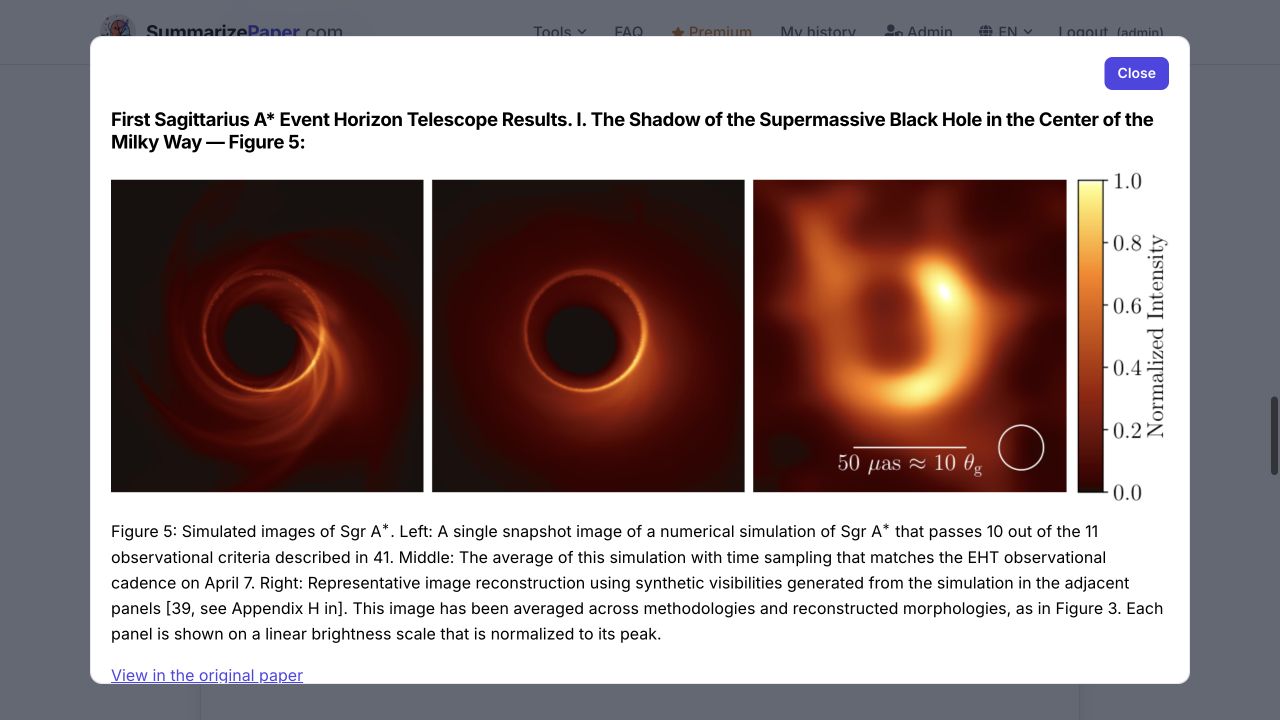
This walkthrough follows one paper: First Sagittarius A* Event Horizon Telescope Results. I, published by the EHT collaboration in 2022 and available on arXiv as 2311.08680v2. It has 24 pages and six figures. Its CC BY 4.0 license permits full-text analysis and display of its figures. Both syntheses generated for this guide explicitly confirm that the full text was used.
Open this paper in Summaries to follow along with the same results.
Start with the paper’s six figures
On the paper page, open “Figures and plots” in the assistant area. The gallery contains all six figures, their captions and a link to the original. Scroll through it to explore the telescope array, the data, the reconstructed image and the model comparisons: each offers a different way into the study.
Figure 3 is a particularly useful starting point: the representative image of Sagittarius A*. Locate the bright ring before tackling the terminology of interferometry.
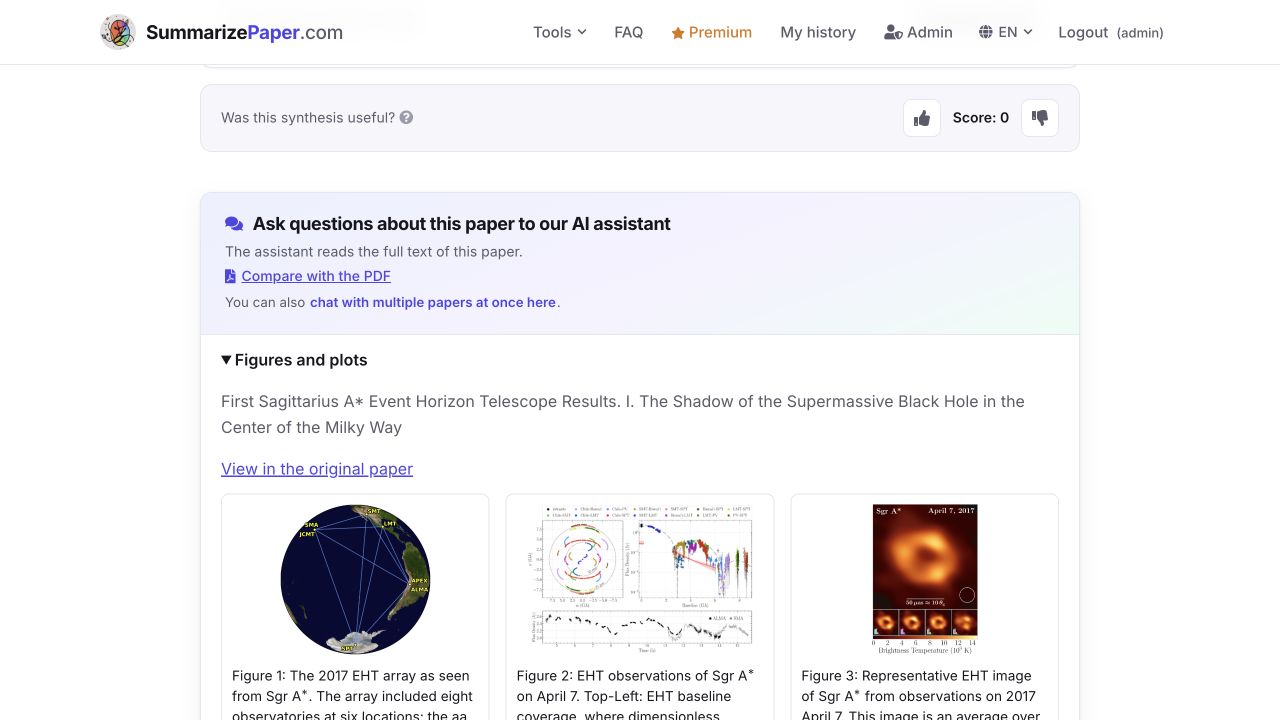
Click a thumbnail to enlarge it. To return to the page, press Escape, use “Close”, or click outside the enlarged window. In Figure 5, shown at the start, three panels compare an instantaneous simulated image, its time average and a reconstruction produced from synthetic data. This helps connect a simulation to what an observation can reconstruct. These panels show a simulation and its reconstruction, rather than three photographs of the sky.
Read the essentials: measurements and interpretations
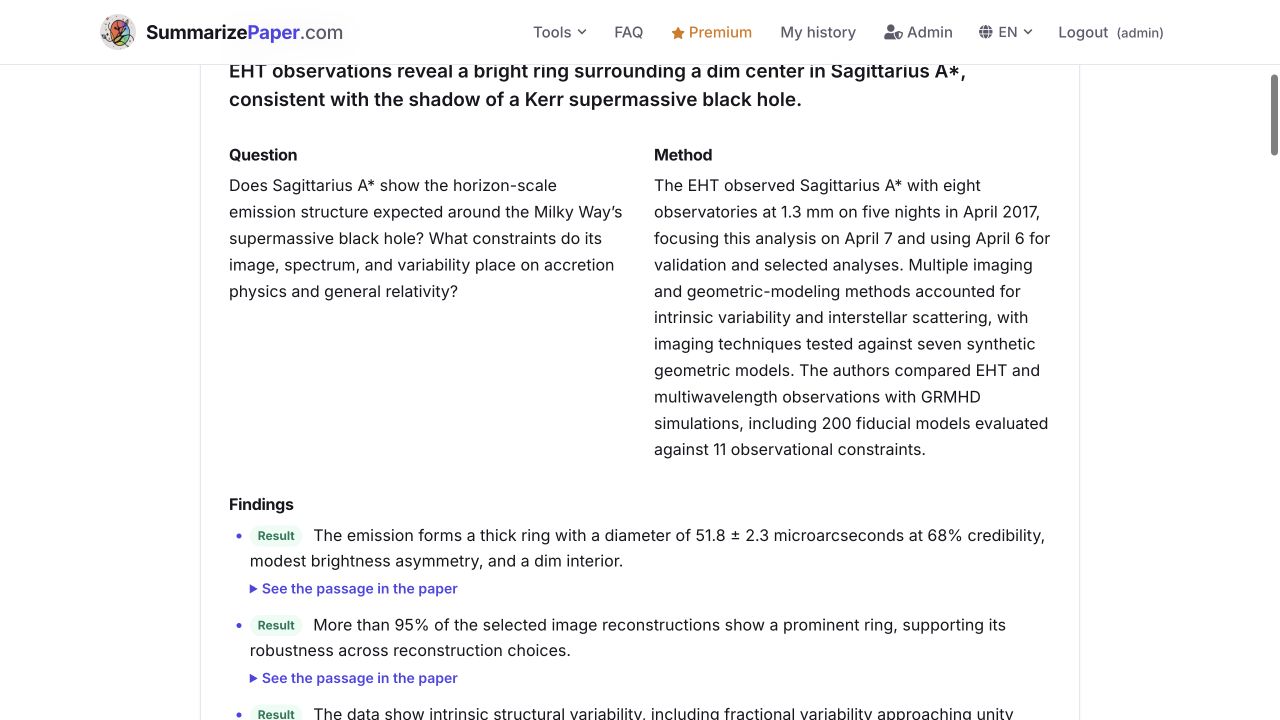
Return to “The essentials”. This block presents the scientific question, method, findings and limitations. For this paper, it includes the ring’s measured diameter, 51.8 ± 2.3 microarcseconds, alongside the difficulty of determining how the image evolves.
The “Result” and “Authors’ interpretation” labels help distinguish a measurement or finding from its physical interpretation. Start here when preparing for a meeting or deciding which section to read closely.
Open evidence that goes beyond the abstract
One detail changes how you read the study: none of the 200 fiducial models satisfies all 11 observational constraints. This limitation comes from the body of the paper and matters when assessing what the simulations still struggle to explain.
Under that finding, open “See the passage in the paper”. Compare the synthesis with the source sentence. Access to the full text brings in methodological and discussion details that the abstract alone does not provide.
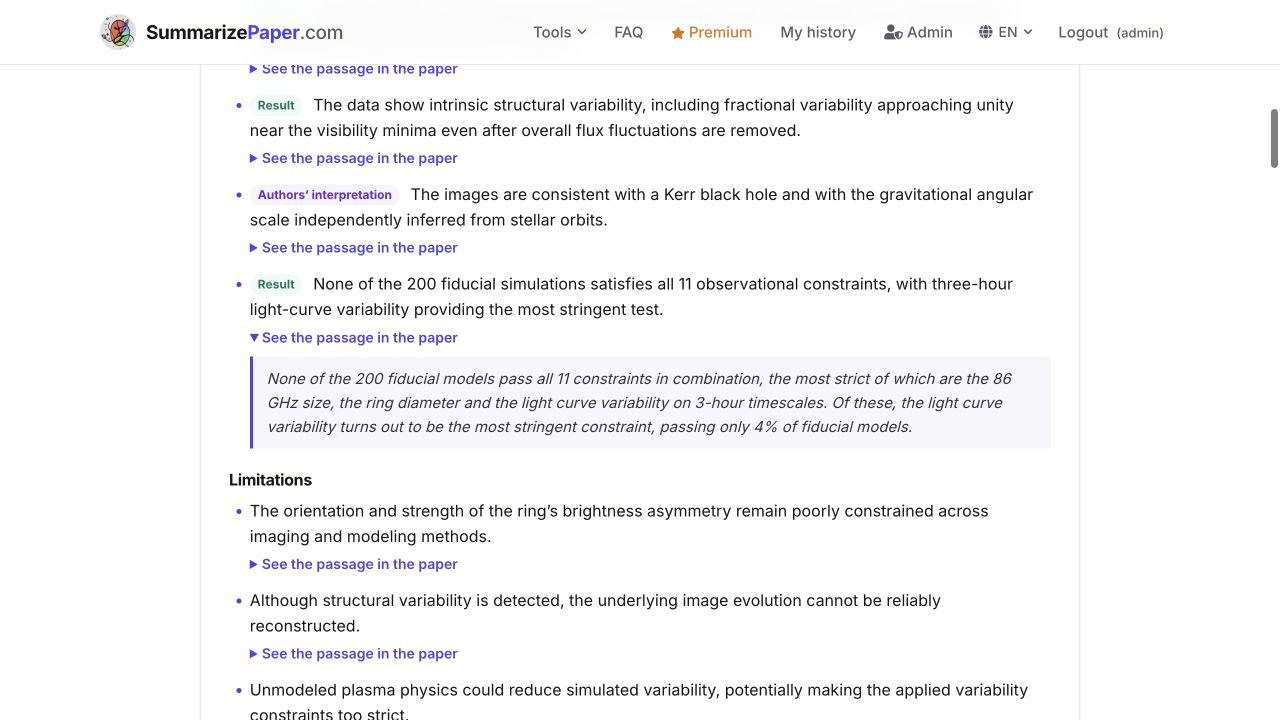
A verified passage establishes that the wording exists in the source; scientific interpretation still requires its context. Open the original paper before citing a claim.
Understand how the image was obtained
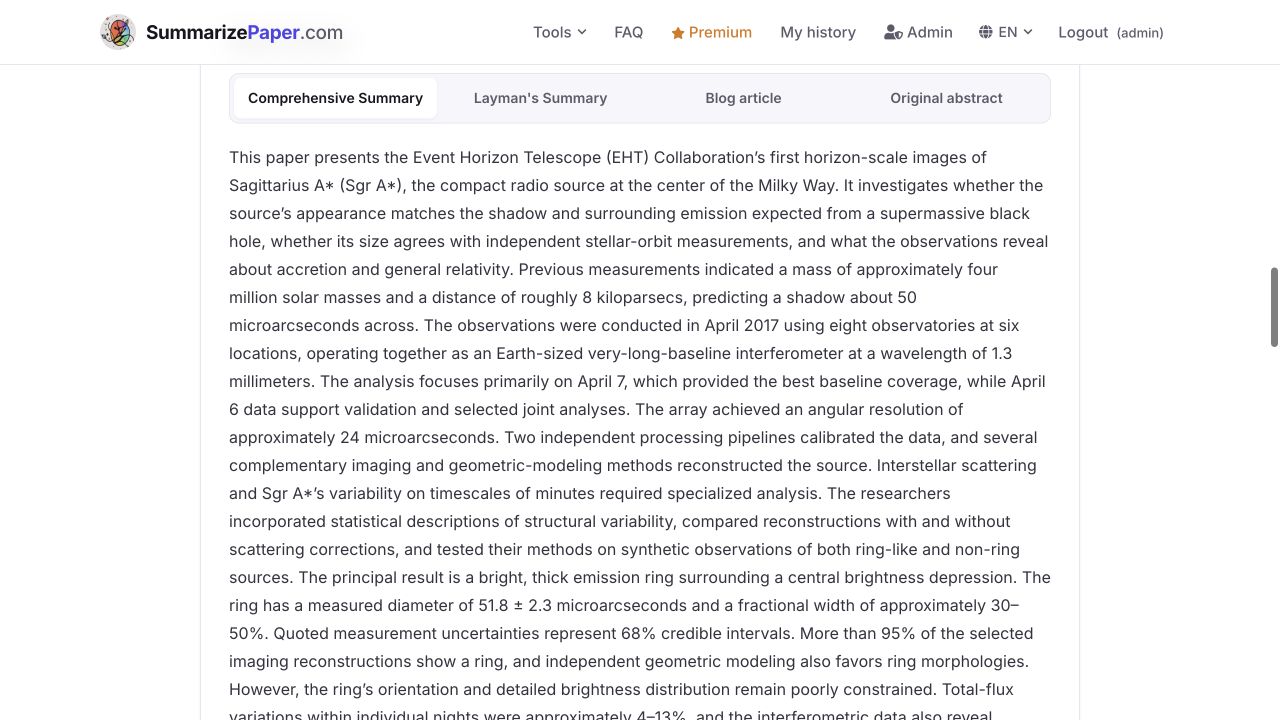
Under “Read further”, choose “Comprehensive Summary”. This version develops the study’s reasoning: observations, variability, reconstruction, simulation comparisons and the scope of its conclusions.
Sagittarius A* changes rapidly, which makes reconstruction difficult. The detailed summary follows this problem and the methods used to address it. Choose this format when preparing a discussion of the methods or noting sections to revisit in the paper.
Build the vocabulary you need
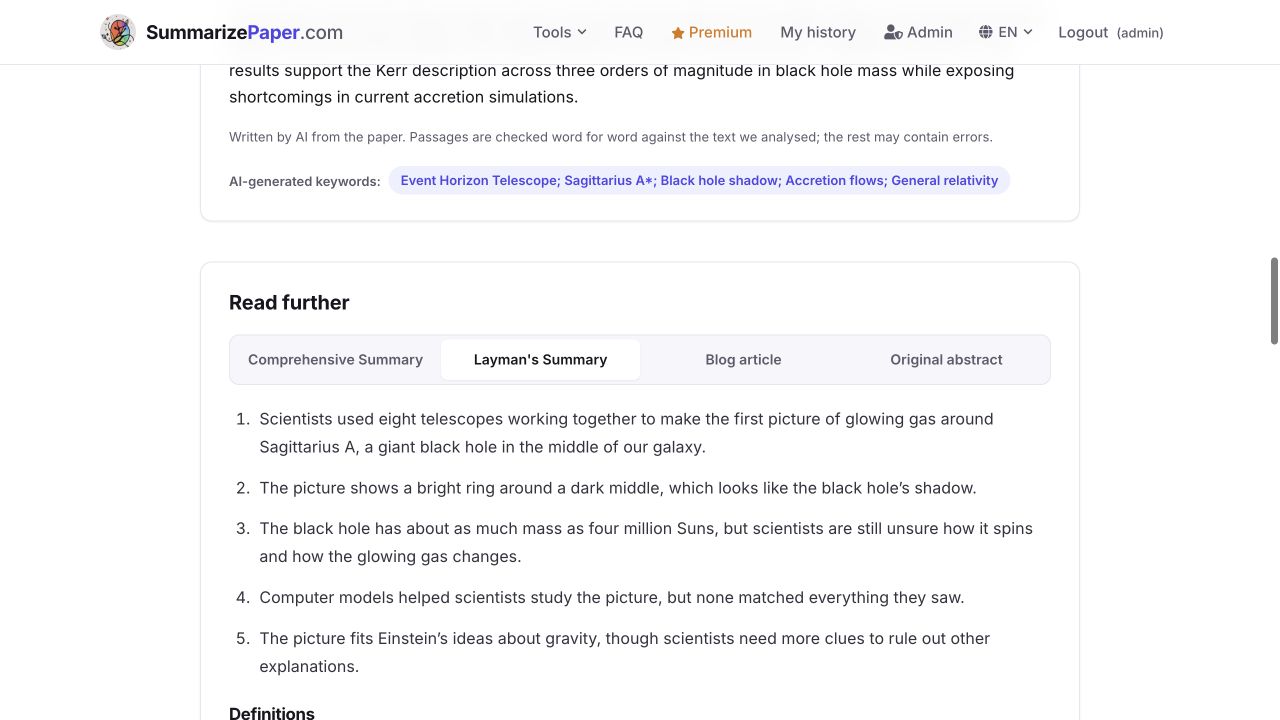
The “Layman’s Summary” tab provides more accessible wording, key points and definitions. In this example, it explains how several telescopes work together and why the darker center matters to the image’s interpretation.
Use it to learn the vocabulary, then return to the findings and their evidence. “Comprehensive Summary”, “Layman’s Summary”, “Blog article” and “Original abstract” remain on the same page, so you can switch formats while keeping the paper in view.
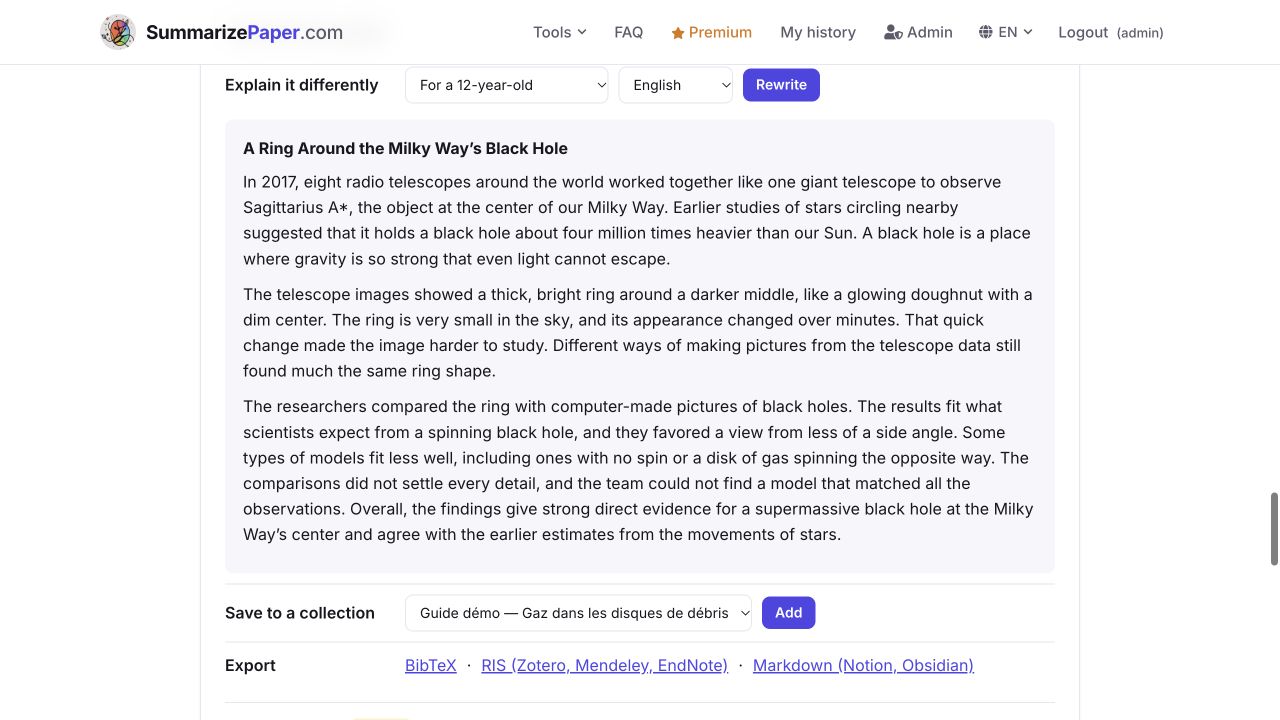
To tailor the explanation further, open “Tools for this paper” → “Explain it differently”. Choose a level and language, then click “Rewrite”. We generated the explanation below for a 12-year-old, in English. It describes the telescope network and bright ring using everyday vocabulary.
Read a connected account of the study
The “Blog article” tab turns the material into a narrative with a title and sections. For this paper, it introduces the Milky Way’s central black hole and the idea of an Earth-sized telescope. Use it as a starting point for a presentation or an explanation for a broader audience.
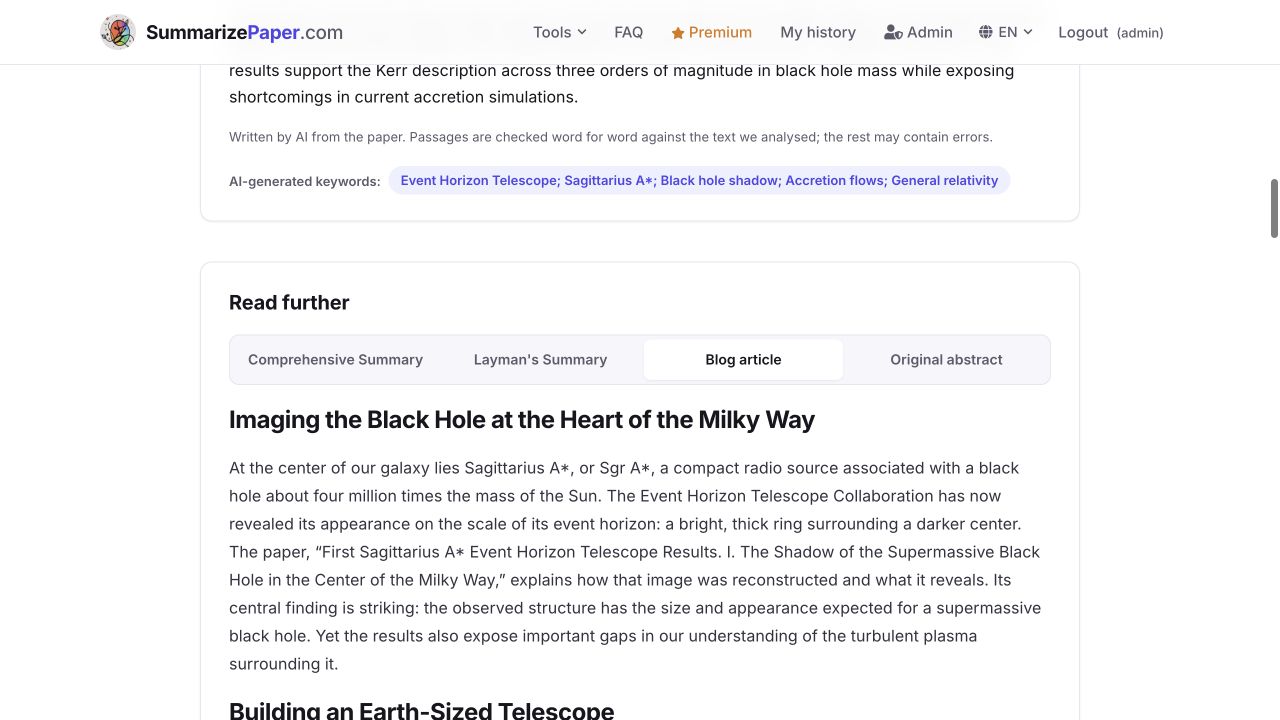
Before reusing a formulation, compare it with the findings and limitations in “The essentials”. “Download as pdf” lets you keep the synthesis. BibTeX, RIS and Markdown exports are also available in the page’s tools.
Try it with your next paper
Paste a paper link, DOI or identifier into SummarizePaper. Check the license and “Sources used for this synthesis” statement: an open license permits analysis, while the statement tells you what the service actually managed to read. To reproduce this full workflow, choose a CC-BY paper with accessible full text and figures.
Read the essentials, open a supporting passage, then choose the explanation format you need. If a figure raises a specific question, continue in the paper’s assistant; the scientific chat guide covers that next step.
Explore the results and all six figures of Sagittarius A* yourself.
Read the paper with SummariesScreenshots of results generated in English on 28 October 2026 using a Premium+ account. Source captions and passages retain their original language. Figures displayed in the interface: EHT collaboration et al. (2022), source paper, under CC BY 4.0. Screenshots show their reduced-size display within SummarizePaper.